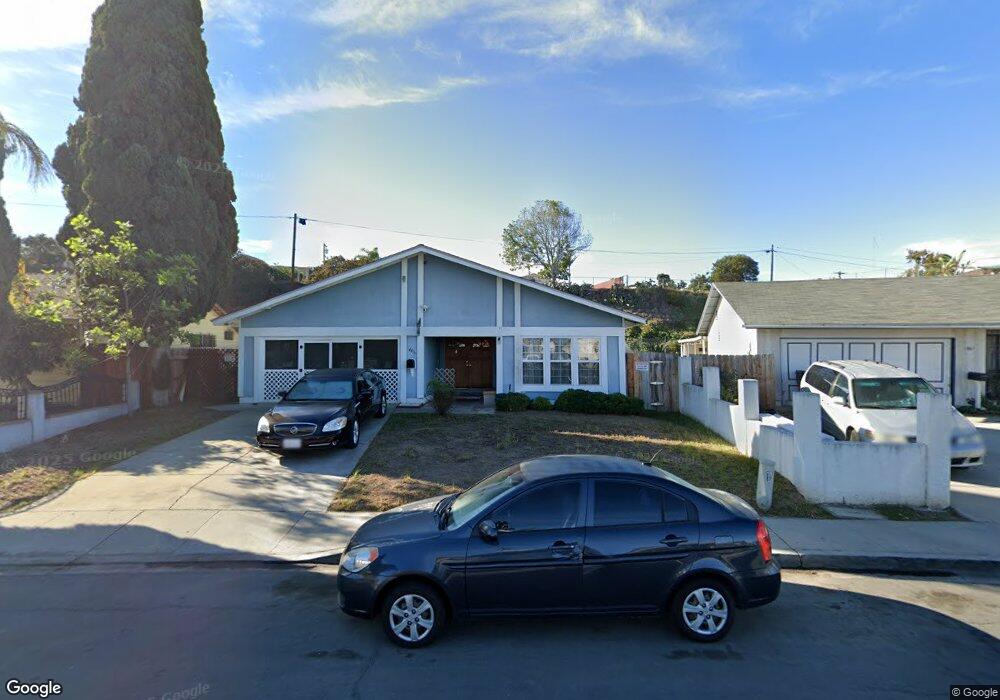
4873 Magnus Way San Diego, CA 92113
Lincoln Park NeighborhoodEstimated Value: $743,776 - $794,000
4
Beds
2
Baths
1,345
Sq Ft
$567/Sq Ft
Est. Value
About This Home
This home is located at 4873 Magnus Way, San Diego, CA 92113 and is currently estimated at $762,944, approximately $567 per square foot. 4873 Magnus Way is a home located in San Diego County with nearby schools including Porter Elementary School, Knox Middle, and Lincoln High School.
Ownership History
Date
Name
Owned For
Owner Type
Purchase Details
Closed on
Jun 1, 1995
Sold by
Myers George
Bought by
Richards Gregory L and Richards Lynette Marie
Current Estimated Value
Home Financials for this Owner
Home Financials are based on the most recent Mortgage that was taken out on this home.
Original Mortgage
$128,520
Interest Rate
7.88%
Mortgage Type
Assumption
Purchase Details
Closed on
Oct 17, 1994
Sold by
First National Mtg Company
Bought by
Myers George
Home Financials for this Owner
Home Financials are based on the most recent Mortgage that was taken out on this home.
Original Mortgage
$50,000
Interest Rate
8.7%
Purchase Details
Closed on
Oct 19, 1993
Sold by
World Equities Inc
Bought by
First National Mtg Company
Create a Home Valuation Report for This Property
The Home Valuation Report is an in-depth analysis detailing your home's value as well as a comparison with similar homes in the area
Home Values in the Area
Average Home Value in this Area
Purchase History
| Date | Buyer | Sale Price | Title Company |
|---|---|---|---|
| Richards Gregory L | $126,000 | Continental Lawyers Title | |
| Myers George | $60,500 | Fidelity National Title | |
| First National Mtg Company | $68,845 | United Title Company |
Source: Public Records
Mortgage History
| Date | Status | Borrower | Loan Amount |
|---|---|---|---|
| Closed | Richards Gregory L | $128,520 | |
| Previous Owner | Myers George | $50,000 |
Source: Public Records
Tax History Compared to Growth
Tax History
| Year | Tax Paid | Tax Assessment Tax Assessment Total Assessment is a certain percentage of the fair market value that is determined by local assessors to be the total taxable value of land and additions on the property. | Land | Improvement |
|---|---|---|---|---|
| 2025 | $2,928 | $247,403 | $104,645 | $142,758 |
| 2024 | $2,928 | $242,553 | $102,594 | $139,959 |
| 2023 | $2,861 | $237,798 | $100,583 | $137,215 |
| 2022 | $2,783 | $233,136 | $98,611 | $134,525 |
| 2021 | $2,763 | $228,566 | $96,678 | $131,888 |
| 2020 | $2,729 | $226,223 | $95,687 | $130,536 |
| 2019 | $2,679 | $221,788 | $93,811 | $127,977 |
| 2018 | $2,504 | $217,440 | $91,972 | $125,468 |
| 2017 | $2,443 | $213,177 | $90,169 | $123,008 |
| 2016 | $2,402 | $208,998 | $88,401 | $120,597 |
| 2015 | $2,365 | $205,860 | $87,074 | $118,786 |
| 2014 | $2,327 | $201,829 | $85,369 | $116,460 |
Source: Public Records
Map
Nearby Homes
- 1370 Wyconda Way
- 5017 Reynolds St
- 5051 Pelusa St
- 2305 Wisteria Way
- 5033 La Paz Dr
- 635 S 47th St Unit 37
- 4895 Bunnell St
- 745 West St
- 812 West St
- 4402 Delta St Unit 23
- 1341 E 4th St
- 325 Gloria St
- 621 R Ave Unit 22
- 4300 Newton Ave Unit 31
- 4300 Newton Ave Unit 106
- 4300 Newton Ave Unit 45
- 4300 Newton Ave Unit 29
- 625 R Ave Unit 28
- 999 E Division St Unit E24
- 5211 Trinidad Way