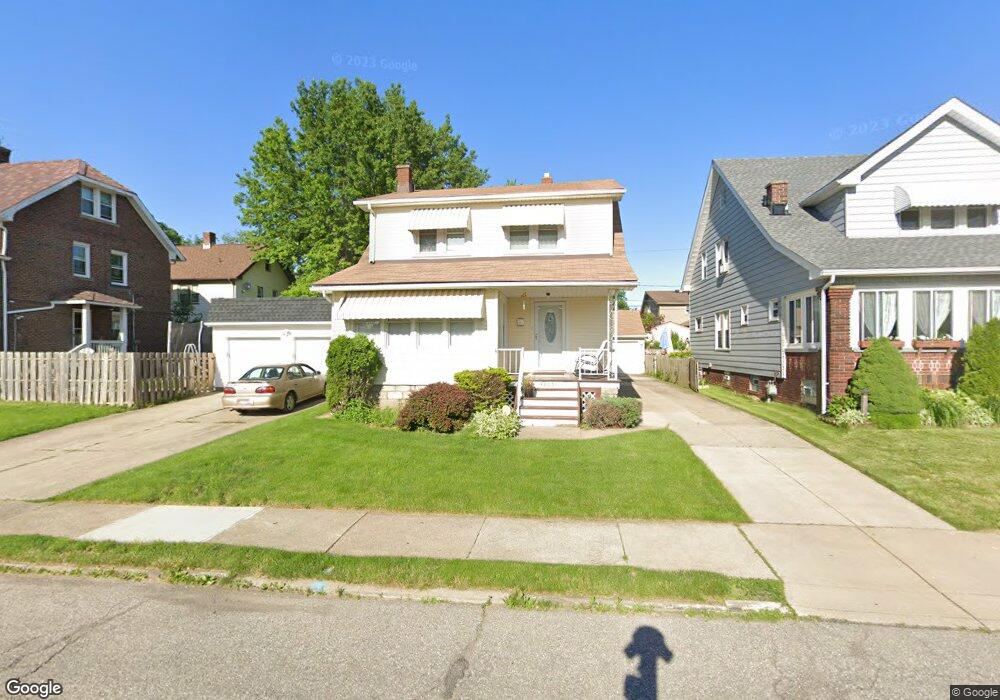
4875 E 106th St Cleveland, OH 44125
Estimated Value: $118,971 - $160,000
3
Beds
1
Bath
1,528
Sq Ft
$89/Sq Ft
Est. Value
About This Home
This home is located at 4875 E 106th St, Cleveland, OH 44125 and is currently estimated at $135,743, approximately $88 per square foot. 4875 E 106th St is a home located in Cuyahoga County with nearby schools including Garfield Heights High School, North Shore High School, and Trinity High School.
Ownership History
Date
Name
Owned For
Owner Type
Purchase Details
Closed on
Jul 23, 2018
Sold by
Latimore Joelene
Bought by
Latimore Joel
Current Estimated Value
Purchase Details
Closed on
Aug 31, 2012
Sold by
Latimore Joel
Bought by
Latimore Joel and Latimore Joelen E
Purchase Details
Closed on
Jul 26, 2007
Sold by
Kosakowski Kathy and Kosakowski Kathleen
Bought by
Latimore Joel
Home Financials for this Owner
Home Financials are based on the most recent Mortgage that was taken out on this home.
Original Mortgage
$107,000
Outstanding Balance
$66,199
Interest Rate
6.76%
Mortgage Type
VA
Estimated Equity
$69,544
Purchase Details
Closed on
Apr 4, 1998
Sold by
Kosakowski Stanley
Bought by
Kosakowski Kathy
Purchase Details
Closed on
Oct 14, 1977
Sold by
Toman Agnes
Bought by
Kosakowski Stanley
Purchase Details
Closed on
Sep 2, 1977
Sold by
Rovter Gertrude
Bought by
Toman Agnes
Purchase Details
Closed on
Jan 1, 1975
Bought by
Rovter Gertrude
Create a Home Valuation Report for This Property
The Home Valuation Report is an in-depth analysis detailing your home's value as well as a comparison with similar homes in the area
Home Values in the Area
Average Home Value in this Area
Purchase History
| Date | Buyer | Sale Price | Title Company |
|---|---|---|---|
| Latimore Joel | -- | None Available | |
| Latimore Joel | -- | Hbi Title | |
| Latimore Joel | $107,000 | Premier Title Agency Ltd | |
| Kosakowski Kathy | -- | -- | |
| Kosakowski Stanley | $26,500 | -- | |
| Toman Agnes | -- | -- | |
| Rovter Gertrude | -- | -- |
Source: Public Records
Mortgage History
| Date | Status | Borrower | Loan Amount |
|---|---|---|---|
| Open | Latimore Joel | $107,000 |
Source: Public Records
Tax History
| Year | Tax Paid | Tax Assessment Tax Assessment Total Assessment is a certain percentage of the fair market value that is determined by local assessors to be the total taxable value of land and additions on the property. | Land | Improvement |
|---|---|---|---|---|
| 2025 | $1,730 | $40,670 | $7,385 | $33,285 |
| 2024 | $2,203 | $40,670 | $7,385 | $33,285 |
| 2023 | $1,024 | $26,500 | $5,040 | $21,460 |
| 2022 | $1,152 | $26,500 | $5,040 | $21,460 |
| 2021 | $1,208 | $26,500 | $5,040 | $21,460 |
| 2020 | $662 | $21,180 | $4,030 | $17,150 |
| 2019 | $658 | $60,500 | $11,500 | $49,000 |
| 2018 | $1,556 | $21,180 | $4,030 | $17,150 |
| 2017 | $2,574 | $19,460 | $3,220 | $16,240 |
| 2016 | $2,611 | $19,460 | $3,220 | $16,240 |
| 2015 | $2,873 | $19,460 | $3,220 | $16,240 |
| 2014 | $2,873 | $23,730 | $3,920 | $19,810 |
Source: Public Records
Map
Nearby Homes
- 4885 E 107th St
- 4902 E 109th St
- 4922 E 109th St
- 10606 Langton Ave
- 10609 Wadsworth Ave
- 4915 E 111th St
- 11017 Vernon Ave
- 10201 Greenview Ave
- 9717 David Rd
- 9717 Alexander Rd
- 10506 Park Heights Ave
- 10925 Mccracken Rd
- 10201 Robinson Ave
- 11206 Park Heights Ave
- 9722 Robinson Ave
- 9516 Alexander Rd
- 4847 E 94th St
- 4839 E 94th St
- 9435 Dorothy Ave
- 9602 Plymouth Ave
- 4879 E 106th St
- 10606 Edgepark Dr
- 4883 E 106th St
- 10612 Edgepark Dr
- 4874 E 107th St
- 10616 Edgepark Dr
- 4878 E 107th St
- 4901 E 106th St
- 4882 E 107th St
- 4874 E 106th St
- 4876 E 106th St
- 10620 Edgepark Dr
- 4880 E 106th St
- 4900 E 107th St
- 4905 E 106th St
- 4900 E 106th St
- 4906 E 107th St
- 4860 E 106th St
- 4909 E 106th St
- 4902 E 106th St
Your Personal Tour Guide
Ask me questions while you tour the home.