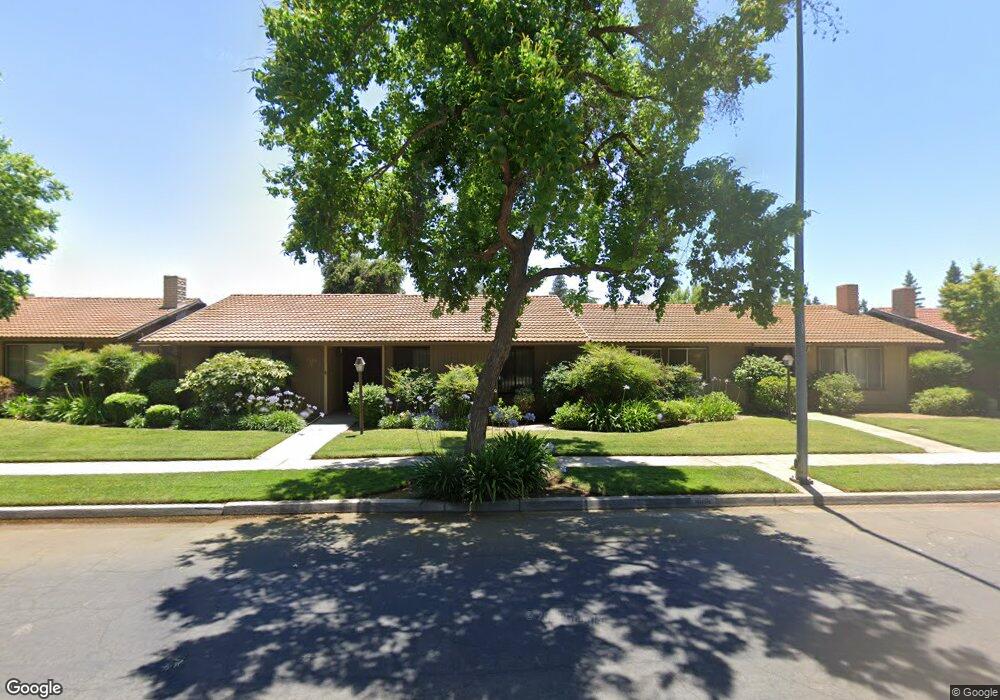
4876 N Hulbert Ave Fresno, CA 93705
Bullard NeighborhoodEstimated Value: $309,000 - $402,000
3
Beds
4
Baths
1,520
Sq Ft
$228/Sq Ft
Est. Value
About This Home
This home is located at 4876 N Hulbert Ave, Fresno, CA 93705 and is currently estimated at $347,093, approximately $228 per square foot. 4876 N Hulbert Ave is a home located in Fresno County with nearby schools including Powers-Ginsburg Elementary, Bullard High School, and Endeavor Charter.
Ownership History
Date
Name
Owned For
Owner Type
Purchase Details
Closed on
Jul 16, 2021
Sold by
Sylvette Boroyan Suzanne
Bought by
Suzanne S Boroyan 2011 Trust
Current Estimated Value
Home Financials for this Owner
Home Financials are based on the most recent Mortgage that was taken out on this home.
Original Mortgage
$240,750
Outstanding Balance
$217,969
Interest Rate
2.9%
Mortgage Type
New Conventional
Estimated Equity
$129,124
Purchase Details
Closed on
Jun 21, 2021
Sold by
Woodman Laura A and The Suzanne S Boroyan 2011 Tru
Bought by
Hedrick Donna and Hedrick Dustin L
Home Financials for this Owner
Home Financials are based on the most recent Mortgage that was taken out on this home.
Original Mortgage
$240,750
Outstanding Balance
$217,969
Interest Rate
2.9%
Mortgage Type
New Conventional
Estimated Equity
$129,124
Purchase Details
Closed on
May 9, 2011
Sold by
Boroyan Suzanne S
Bought by
Boroyan Suzanne S and Suzanne S Boroyan 2011 Trust
Create a Home Valuation Report for This Property
The Home Valuation Report is an in-depth analysis detailing your home's value as well as a comparison with similar homes in the area
Home Values in the Area
Average Home Value in this Area
Purchase History
| Date | Buyer | Sale Price | Title Company |
|---|---|---|---|
| Suzanne S Boroyan 2011 Trust | -- | -- | |
| Hedrick Donna | $267,500 | Chicago Title Company | |
| Boroyan Suzanne S | -- | None Available |
Source: Public Records
Mortgage History
| Date | Status | Borrower | Loan Amount |
|---|---|---|---|
| Open | Hedrick Donna | $240,750 |
Source: Public Records
Tax History Compared to Growth
Tax History
| Year | Tax Paid | Tax Assessment Tax Assessment Total Assessment is a certain percentage of the fair market value that is determined by local assessors to be the total taxable value of land and additions on the property. | Land | Improvement |
|---|---|---|---|---|
| 2025 | $3,462 | $283,871 | $70,569 | $213,302 |
| 2023 | $3,394 | $272,850 | $67,830 | $205,020 |
| 2022 | $3,346 | $267,500 | $66,500 | $201,000 |
| 2021 | $2,212 | $179,972 | $62,933 | $117,039 |
| 2020 | $2,201 | $178,127 | $62,288 | $115,839 |
| 2019 | $2,115 | $174,635 | $61,067 | $113,568 |
| 2018 | $1,928 | $160,000 | $40,000 | $120,000 |
| 2017 | $1,870 | $155,000 | $38,000 | $117,000 |
| 2016 | $1,660 | $140,000 | $35,000 | $105,000 |
| 2015 | $1,598 | $135,000 | $33,000 | $102,000 |
| 2014 | $1,536 | $130,000 | $32,000 | $98,000 |
Source: Public Records
Map
Nearby Homes
- 4848 N Hulbert Ave Unit 102
- 4880 N Hulbert Ave Unit 101
- 4908 N Sequoia Ave Unit 102
- 4856 N Hulbert Ave Unit 101
- 1866 W Santa Ana Ave Unit 101
- 4914 N Sequoia Dr
- 2013 W Fairmont Ave
- 1705 W Santa Ana Ave
- 1763 W Santa Ana Ave
- 1751 W Santa Ana Ave
- 1749 W Santa Ana Ave
- 5088 N Forkner Ave
- 5039 N Van Ness Blvd
- 4707 N Kavanagh Ave
- 1410 W Rialto Ave
- 5072 N Forkner Ave
- 2151 W Pico Ave
- 2190 W Via Cipressi
- 5125 N Via Amore
- 4924 N Holt Ave Unit 103
- 4876 N Hulbert Ave Unit 101
- 4876 N Hulbert Ave Unit 103
- 4876 N Hulbert Ave Unit 102
- 4876 N Hulbert Ave
- 4876 N Hulbert Ave
- 4880 N Hulbert Ave Unit 102
- 4880 N Hulbert Ave
- 4880 N Hulbert Ave
- 4864 N Hulbert Ave Unit 103
- 4864 N Hulbert Ave
- 4864 N Hulbert Ave
- 4864 N Hulbert Ave
- 1903 W Fairmont Ave Unit 101
- 1903 W Fairmont Ave Unit 102
- 4860 N Hulbert Ave Unit 101
- 4860 N Hulbert Ave Unit 102
- 4860 N Hulbert Ave
- 1931 W Fairmont Ave Unit 102
- 1931 W Fairmont Ave
- 1931 W Fairmont Ave