Estimated Value: $451,949 - $544,000
4
Beds
4
Baths
2,676
Sq Ft
$191/Sq Ft
Est. Value
About This Home
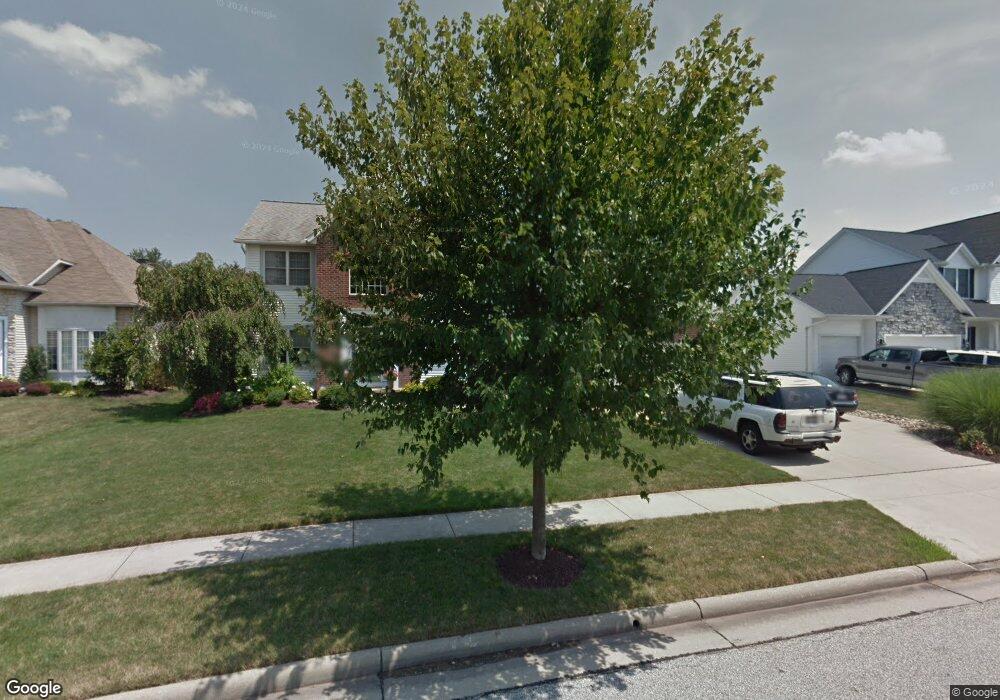
This home is located at 4877 Pebblehurst Dr, Stow, OH 44224 and is currently estimated at $511,237, approximately $191 per square foot. 4877 Pebblehurst Dr is a home located in Summit County with nearby schools including Stow-Munroe Falls High School, Primrose School of Hudson, and Holy Family Elementary School.
Ownership History
Date
Name
Owned For
Owner Type
Purchase Details
Closed on
Aug 6, 2013
Sold by
Marino Charles A and Marino Laura A
Bought by
Marino Charles A and Marino Laura A
Current Estimated Value
Purchase Details
Closed on
Oct 25, 2008
Sold by
Al Hafi Nimer and Al Hafi Omara
Bought by
Marino Laura A and Marino Charles A
Home Financials for this Owner
Home Financials are based on the most recent Mortgage that was taken out on this home.
Original Mortgage
$108,000
Interest Rate
5.73%
Mortgage Type
Purchase Money Mortgage
Purchase Details
Closed on
Jul 15, 2003
Sold by
Mizer Donna
Bought by
Alhafi Nimer and Alhafi Omara
Home Financials for this Owner
Home Financials are based on the most recent Mortgage that was taken out on this home.
Original Mortgage
$277,900
Interest Rate
5.8%
Mortgage Type
Purchase Money Mortgage
Purchase Details
Closed on
Sep 11, 2000
Sold by
Pebblehurst
Bought by
Mizer Raymond J and Mizer Donna
Create a Home Valuation Report for This Property
The Home Valuation Report is an in-depth analysis detailing your home's value as well as a comparison with similar homes in the area
Home Values in the Area
Average Home Value in this Area
Purchase History
| Date | Buyer | Sale Price | Title Company |
|---|---|---|---|
| Marino Charles A | -- | None Available | |
| Marino Laura A | $278,000 | Abby Title | |
| Alhafi Nimer | $277,900 | Village Title Agency | |
| Mizer Raymond J | $71,500 | -- |
Source: Public Records
Mortgage History
| Date | Status | Borrower | Loan Amount |
|---|---|---|---|
| Previous Owner | Marino Laura A | $108,000 | |
| Previous Owner | Alhafi Nimer | $277,900 |
Source: Public Records
Tax History Compared to Growth
Tax History
| Year | Tax Paid | Tax Assessment Tax Assessment Total Assessment is a certain percentage of the fair market value that is determined by local assessors to be the total taxable value of land and additions on the property. | Land | Improvement |
|---|---|---|---|---|
| 2025 | $7,076 | $125,993 | $29,470 | $96,523 |
| 2024 | $7,076 | $125,993 | $29,470 | $96,523 |
| 2023 | $7,076 | $125,993 | $29,470 | $96,523 |
| 2022 | $6,733 | $105,879 | $24,766 | $81,113 |
| 2021 | $6,025 | $105,879 | $24,766 | $81,113 |
| 2020 | $5,921 | $105,880 | $24,770 | $81,110 |
| 2019 | $5,750 | $96,110 | $24,770 | $71,340 |
| 2018 | $5,656 | $96,110 | $24,770 | $71,340 |
| 2017 | $5,301 | $96,110 | $24,770 | $71,340 |
| 2016 | $5,457 | $87,520 | $24,770 | $62,750 |
| 2015 | $5,301 | $87,520 | $24,770 | $62,750 |
| 2014 | $5,306 | $87,520 | $24,770 | $62,750 |
| 2013 | $5,275 | $87,570 | $24,770 | $62,800 |
Source: Public Records
Map
Nearby Homes
- 4901 Pebblehurst Dr
- 4944 Friar Rd Unit D
- 4901 Independence Cir Unit B
- 2444 Port Charles Dr
- 4604 Muirwood Place
- 2380 Port Williams Dr Unit 2380
- 5465 Park Vista Ct
- 2418 Wrens Dr S Unit G
- 2327 Crockett Cir
- 4731 Haughton Ct
- 0 Stow Rd Unit 5102979
- 4903 Fishcreek Rd Unit 11B
- 5473 Young Rd
- 5431 Diana Lynn Dr
- 5239 Camden Dr
- 3165 Peterboro Dr
- 5217 Beckett Ridge
- 2908 Wexford Blvd
- 4233 Smokerise Dr
- 4451 Newcomer Rd
- 4867 Pebblehurst Dr
- 4885 Pebblehurst Dr
- 4859 Pebblehurst Dr
- 4893 Pebblehurst Dr
- 4880 Pebblehurst Dr
- 4866 Pebblehurst Dr
- 0 Pebblehurst Dr Unit 3968656
- 4851 Pebblehurst Dr
- 4858 Pebblehurst Dr
- 4908 Pebblehurst Dr
- 4850 Pebblehurst Dr
- 4909 Pebblehurst Dr
- 4843 Pebblehurst Dr
- 4928 Pebblehurst Dr
- 4917 Pebblehurst Dr
- 4842 Pebblehurst Dr
- 4925 Pebblehurst Dr
- 4831 Pebblehurst Dr
- 4942 Pebblehurst Dr
- 4830 Pebblehurst Dr