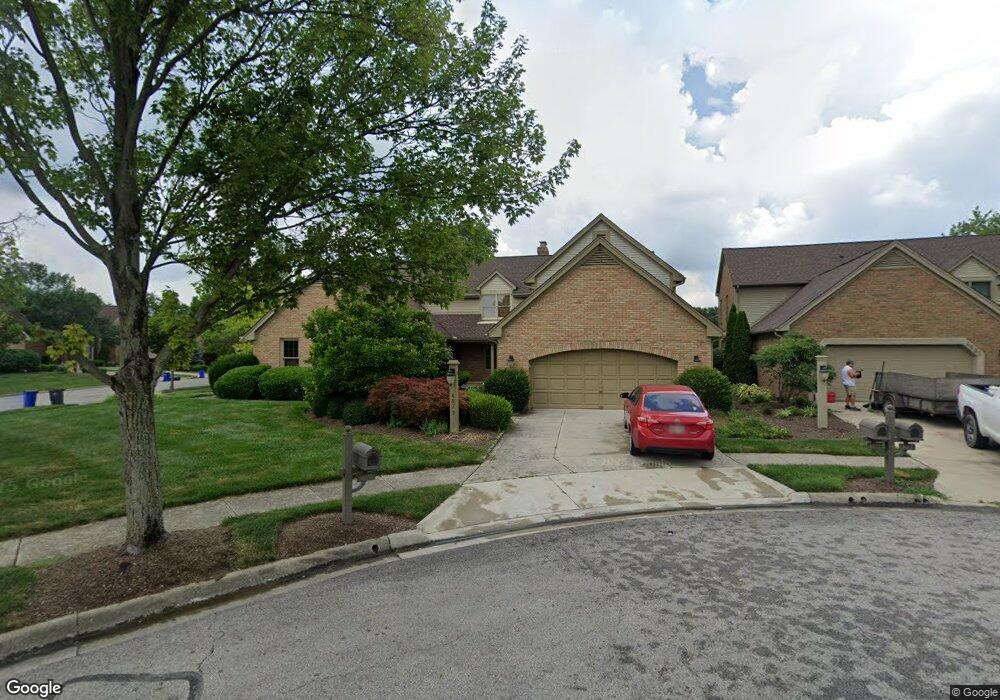
4877 Shackelford Ct Upper Arlington, OH 43220
Estimated Value: $490,000 - $551,000
2
Beds
3
Baths
2,812
Sq Ft
$184/Sq Ft
Est. Value
About This Home
This home is located at 4877 Shackelford Ct, Upper Arlington, OH 43220 and is currently estimated at $518,003, approximately $184 per square foot. 4877 Shackelford Ct is a home located in Franklin County with nearby schools including Greensview Elementary School, Hastings Middle School, and Upper Arlington High School.
Ownership History
Date
Name
Owned For
Owner Type
Purchase Details
Closed on
Apr 20, 2022
Sold by
Adams Corlene M
Bought by
Macklis Paul C
Current Estimated Value
Purchase Details
Closed on
Jan 24, 2003
Sold by
Palmer Thomas E and Palmer Victoria C
Bought by
Adams Corlene M
Purchase Details
Closed on
Feb 7, 2000
Sold by
Trustees Miller William Trust Russin Marsha & and Miller Marjorie E
Bought by
Palmer Thomas E and Palmer Victoria C
Purchase Details
Closed on
Jan 19, 1994
Purchase Details
Closed on
May 25, 1990
Create a Home Valuation Report for This Property
The Home Valuation Report is an in-depth analysis detailing your home's value as well as a comparison with similar homes in the area
Home Values in the Area
Average Home Value in this Area
Purchase History
| Date | Buyer | Sale Price | Title Company |
|---|---|---|---|
| Macklis Paul C | $475,000 | Northwest Title | |
| Adams Corlene M | $240,000 | Chicago Title | |
| Palmer Thomas E | $215,000 | Chicago Title | |
| -- | $192,500 | -- | |
| -- | $192,500 | -- |
Source: Public Records
Tax History Compared to Growth
Tax History
| Year | Tax Paid | Tax Assessment Tax Assessment Total Assessment is a certain percentage of the fair market value that is determined by local assessors to be the total taxable value of land and additions on the property. | Land | Improvement |
|---|---|---|---|---|
| 2024 | $8,551 | $147,700 | $12,250 | $135,450 |
| 2023 | $9,660 | $168,945 | $12,250 | $156,695 |
| 2022 | $10,027 | $152,250 | $21,000 | $131,250 |
| 2021 | $8,877 | $152,250 | $21,000 | $131,250 |
| 2020 | $8,798 | $152,250 | $21,000 | $131,250 |
| 2019 | $8,192 | $126,880 | $17,500 | $109,380 |
| 2018 | $7,769 | $126,880 | $17,500 | $109,380 |
| 2017 | $7,764 | $126,880 | $17,500 | $109,380 |
| 2016 | $7,399 | $120,650 | $18,380 | $102,270 |
| 2015 | $7,392 | $120,650 | $18,380 | $102,270 |
| 2014 | $7,401 | $120,650 | $18,380 | $102,270 |
| 2013 | $3,688 | $114,905 | $17,500 | $97,405 |
Source: Public Records
Map
Nearby Homes
- 2165 Partlow Dr
- 2198 Sandston Rd
- 4781 Coach Rd
- 2231 Atlee Ct Unit 12
- 4861 Etrick Dr Unit 22
- 2248 Sandover Rd
- 2060 Fontenay Place
- 4740 Merrifield Place Unit 25
- 4720 Merrifield Place Unit 67
- 1865 Willoway Cir N Unit 1865
- 1835 Willoway Cir N
- 4450 Haverford Ct
- 5268 Captains Ct
- 1961 Ramble Branch Dr Unit 30
- 4924 Reed Rd Unit B
- 5000 Slate Run Woods Ct
- 2172 Hedgerow Rd Unit 2172G
- 5283 Ruthton Rd Unit 19
- 2560 Chartwell Rd
- 5244 Greensedge Way Unit 12
- 2140 Partlow Dr
- 4877 Shackleford Ct
- 4885 Shackelford Ct
- 4881 Shackelford Ct
- 4885 Shackleford Ct Unit 4885
- 4881 Shackleford Ct Unit 4881
- 2156 Partlow Dr Unit 2156
- 2166 Partlow Dr
- 4890 Shackelford Ct
- 4886 Shackleford Ct
- 4886 Shackelford Ct
- 2147 Partlow Dr
- 2174 Partlow Dr Unit 2174
- 4853 Shackleford Ct Unit 4853
- 4876 Shackleford Ct Unit 4876
- 4880 Shackleford Ct Unit 4880
- 4870 Shackleford Ct
- 4870 Shackelford Ct
- 2153 Partlow Dr Unit 2153