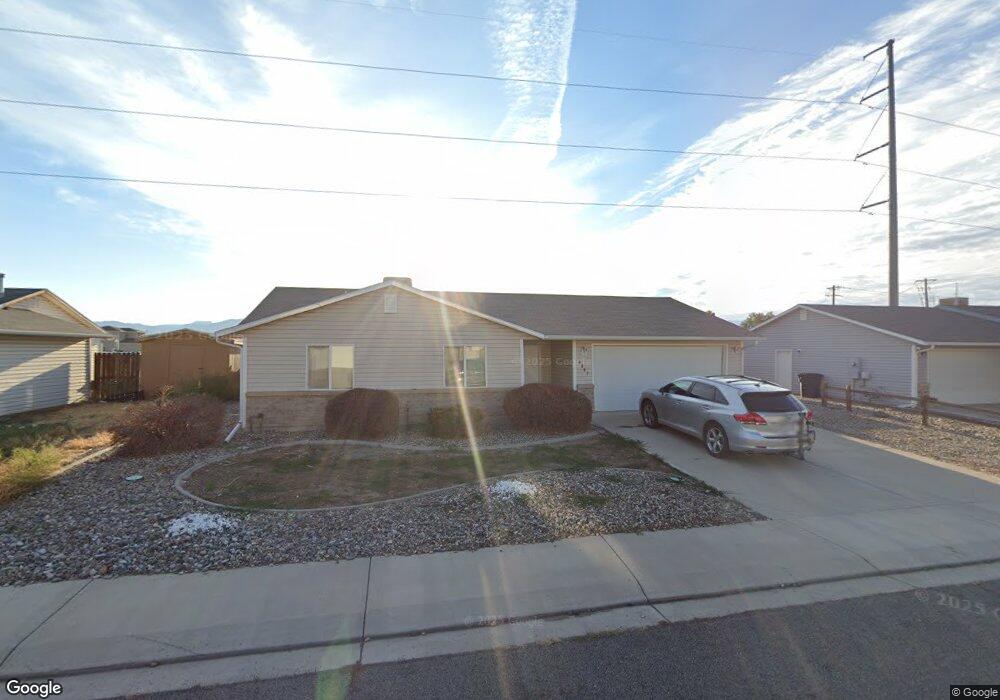
488 1/2 Fox Run St Clifton, CO 81520
Estimated Value: $323,548 - $348,000
3
Beds
2
Baths
1,166
Sq Ft
$291/Sq Ft
Est. Value
About This Home
This home is located at 488 1/2 Fox Run St, Clifton, CO 81520 and is currently estimated at $339,637, approximately $291 per square foot. 488 1/2 Fox Run St is a home located in Mesa County with nearby schools including Rocky Mountain Elementary School, Mount Garfield Middle School, and Palisade High School.
Ownership History
Date
Name
Owned For
Owner Type
Purchase Details
Closed on
Oct 28, 2016
Sold by
Henderson Shawn T and Henderson Melinda M
Bought by
St Pierre Madeleine M and St Pierre Mark W
Current Estimated Value
Home Financials for this Owner
Home Financials are based on the most recent Mortgage that was taken out on this home.
Original Mortgage
$59,000
Outstanding Balance
$47,486
Interest Rate
3.5%
Mortgage Type
New Conventional
Estimated Equity
$292,151
Purchase Details
Closed on
Feb 27, 2012
Sold by
Stroh Sharon A
Bought by
Henderson Shawn T and Henderson Melinda M
Home Financials for this Owner
Home Financials are based on the most recent Mortgage that was taken out on this home.
Original Mortgage
$131,577
Interest Rate
3.75%
Mortgage Type
FHA
Purchase Details
Closed on
Jul 20, 2004
Sold by
Gary Rindle Construction Inc
Bought by
Stroh Sharon A
Create a Home Valuation Report for This Property
The Home Valuation Report is an in-depth analysis detailing your home's value as well as a comparison with similar homes in the area
Home Values in the Area
Average Home Value in this Area
Purchase History
| Date | Buyer | Sale Price | Title Company |
|---|---|---|---|
| St Pierre Madeleine M | $159,900 | Fidelity National Title Insu | |
| Henderson Shawn T | $135,000 | Abstract & Title Company Of | |
| Stroh Sharon A | $117,872 | Meridian Land Title Llc |
Source: Public Records
Mortgage History
| Date | Status | Borrower | Loan Amount |
|---|---|---|---|
| Open | St Pierre Madeleine M | $59,000 | |
| Previous Owner | Henderson Shawn T | $131,577 |
Source: Public Records
Tax History Compared to Growth
Tax History
| Year | Tax Paid | Tax Assessment Tax Assessment Total Assessment is a certain percentage of the fair market value that is determined by local assessors to be the total taxable value of land and additions on the property. | Land | Improvement |
|---|---|---|---|---|
| 2024 | $1,149 | $15,450 | $2,980 | $12,470 |
| 2023 | $1,149 | $15,450 | $2,980 | $12,470 |
| 2022 | $1,153 | $15,220 | $3,480 | $11,740 |
| 2021 | $1,157 | $15,650 | $3,580 | $12,070 |
| 2020 | $959 | $13,260 | $2,500 | $10,760 |
| 2019 | $910 | $13,260 | $2,500 | $10,760 |
| 2018 | $843 | $11,250 | $2,160 | $9,090 |
| 2017 | $713 | $11,250 | $2,160 | $9,090 |
| 2016 | $713 | $11,030 | $2,190 | $8,840 |
| 2015 | $723 | $11,030 | $2,190 | $8,840 |
| 2014 | $609 | $9,320 | $1,990 | $7,330 |
Source: Public Records
Map
Nearby Homes
- 3300 Pyrus St
- 3307 Swan View Ct
- 3310 Pyrus St
- 3313 Pyrus St
- 3298 Swift Fox Ct
- 476 Forelle St
- 475 El Jardin Ln
- 507 Desert Peach St
- 510 Desert Peach St
- 466 El Jardin Ln
- 520 Desert Peach St
- 3268 E Rd Unit 43
- 3268 E Rd Unit 90
- 3268 E Rd Unit 1
- 3268 E Rd Unit 45
- 3251 E Rd Unit 100
- 3251 E Rd Unit 106
- 3251 E Rd Unit 22
- 3251 E Rd Unit 63
- 3312 E 1 4 Rd
- 488 Fox Run St
- 488 Fox Run
- 489 Fox Run St
- 486 Fox Run St
- 3298 Red Fox Ct
- 486 1/2 Fox Run St
- 490 Fox Run St
- 3297 Silver Fox Ct
- 490 1/2 Fox Run St
- 0 Silver Fox Ct Unit 597238
- 0 Fox Run Unit 768209
- 0 Fox Run Unit 607911
- 0 Fox Run Unit 622123
- 0 Fox Run Unit 627415
- 0 Fox Run Unit 646061
- 0 Fox Run Unit 648447
- 3296 Red Fox Ct
- 486 Fox Run
- 3295 Silver Fox Ct
- 499 Red Fox Ct