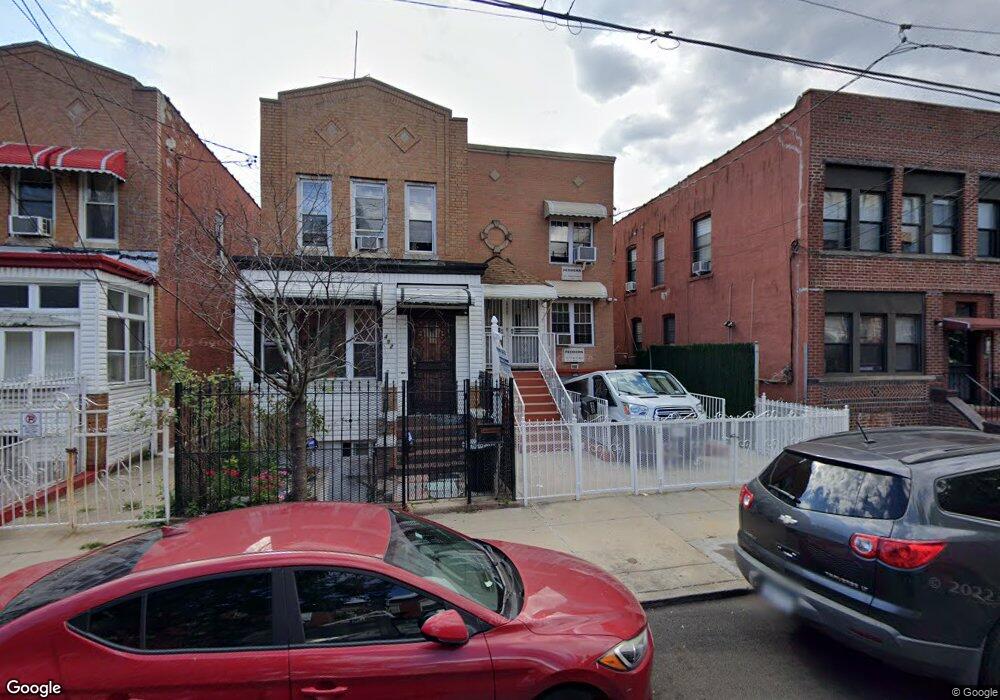
488 Logan St Brooklyn, NY 11208
East New York NeighborhoodEstimated Value: $792,926 - $1,014,000
Studio
--
Bath
2,040
Sq Ft
$466/Sq Ft
Est. Value
About This Home
This home is located at 488 Logan St, Brooklyn, NY 11208 and is currently estimated at $950,732, approximately $466 per square foot. 488 Logan St is a home located in Kings County with nearby schools including P.S. 345 Patrolman Robert Bolden, Liberty Avenue Middle School, and Vista Academy.
Ownership History
Date
Name
Owned For
Owner Type
Purchase Details
Closed on
Mar 2, 2007
Sold by
Cityside Equities Llc
Bought by
Facey Audley and Facey Veronica
Current Estimated Value
Home Financials for this Owner
Home Financials are based on the most recent Mortgage that was taken out on this home.
Original Mortgage
$109,800
Outstanding Balance
$66,307
Interest Rate
6.4%
Estimated Equity
$884,425
Purchase Details
Closed on
Aug 8, 2006
Sold by
Db Real Estate Enterprises Llc and Brian M
Bought by
Cityside Equities Llc
Purchase Details
Closed on
Aug 31, 2004
Sold by
Young Helen
Bought by
Db Real Estate Enterprises Llc
Purchase Details
Closed on
Jun 17, 2003
Sold by
Mark A Longo Esq As Referee
Bought by
Young Helen
Create a Home Valuation Report for This Property
The Home Valuation Report is an in-depth analysis detailing your home's value as well as a comparison with similar homes in the area
Home Values in the Area
Average Home Value in this Area
Purchase History
| Date | Buyer | Sale Price | Title Company |
|---|---|---|---|
| Facey Audley | $549,000 | -- | |
| Facey Audley | $549,000 | -- | |
| Cityside Equities Llc | $140,000 | -- | |
| Cityside Equities Llc | $140,000 | -- | |
| Db Real Estate Enterprises Llc | $25,000 | -- | |
| Db Real Estate Enterprises Llc | $25,000 | -- | |
| Young Helen | $40,000 | -- | |
| Young Helen | $40,000 | -- |
Source: Public Records
Mortgage History
| Date | Status | Borrower | Loan Amount |
|---|---|---|---|
| Open | Facey Audley | $109,800 | |
| Closed | Facey Audley | $109,800 | |
| Open | Facey Audley | $439,200 | |
| Closed | Facey Audley | $439,200 |
Source: Public Records
Tax History
| Year | Tax Paid | Tax Assessment Tax Assessment Total Assessment is a certain percentage of the fair market value that is determined by local assessors to be the total taxable value of land and additions on the property. | Land | Improvement |
|---|---|---|---|---|
| 2025 | $8,267 | $51,180 | $6,480 | $44,700 |
| 2024 | $8,267 | $43,440 | $6,480 | $36,960 |
| 2023 | $7,886 | $48,480 | $6,480 | $42,000 |
| 2022 | $7,313 | $43,800 | $6,480 | $37,320 |
| 2021 | $7,273 | $34,560 | $6,480 | $28,080 |
| 2020 | $3,899 | $41,880 | $6,480 | $35,400 |
| 2019 | $7,355 | $35,160 | $6,480 | $28,680 |
| 2018 | $7,124 | $34,947 | $5,177 | $29,770 |
| 2017 | $6,721 | $32,970 | $4,851 | $28,119 |
| 2016 | $6,218 | $31,104 | $5,694 | $25,410 |
| 2015 | $3,751 | $31,104 | $4,937 | $26,167 |
| 2014 | $3,751 | $29,580 | $5,400 | $24,180 |
Source: Public Records
Map
Nearby Homes
- 447 Logan St
- 184 Milford St
- 196 Fountain Ave
- 210 Montauk Ave
- 194 Crystal St
- 928 Belmont Ave
- 2540 Pitkin Ave
- 1145 Sutter Ave
- 900 Glenmore Ave
- 842 Belmont Ave
- 126 Crystal St
- 1140 Sutter Ave
- 208 Atkins Ave
- 127 Crystal St
- 852 Glenmore Ave
- 139 Milford St
- 577 Logan St
- 283 Montauk Ave
- 195 Berriman St
- 170 Atkins Ave
Your Personal Tour Guide
Ask me questions while you tour the home.