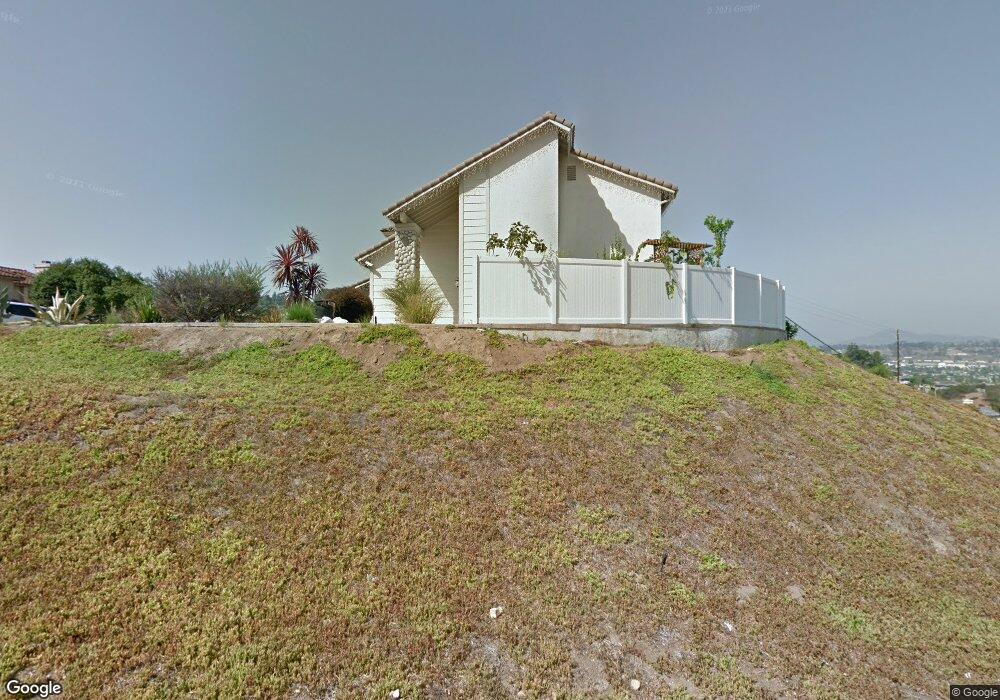
488 Nila Ln El Cajon, CA 92020
Estimated Value: $1,167,000 - $1,481,000
4
Beds
3
Baths
2,372
Sq Ft
$555/Sq Ft
Est. Value
About This Home
This home is located at 488 Nila Ln, El Cajon, CA 92020 and is currently estimated at $1,317,497, approximately $555 per square foot. 488 Nila Ln is a home located in San Diego County with nearby schools including Fuerte Elementary School, Hillsdale Middle School, and Valhalla High.
Ownership History
Date
Name
Owned For
Owner Type
Purchase Details
Closed on
Aug 31, 2015
Sold by
Williams Brian Curtis and Williams Ola Dianne
Bought by
Odesh Gemes
Current Estimated Value
Home Financials for this Owner
Home Financials are based on the most recent Mortgage that was taken out on this home.
Original Mortgage
$458,500
Outstanding Balance
$360,122
Interest Rate
3.91%
Mortgage Type
New Conventional
Estimated Equity
$957,375
Purchase Details
Closed on
Mar 24, 2005
Sold by
Williams Brian C and Williams Ola Dianne
Bought by
Williams Brian Curtis and Williams Ola Dianne
Purchase Details
Closed on
Mar 20, 1998
Sold by
Knecht Leroy P and Knecht Connie M
Bought by
Williams Brian C and Williams Ola Dianne
Home Financials for this Owner
Home Financials are based on the most recent Mortgage that was taken out on this home.
Original Mortgage
$135,000
Interest Rate
7.07%
Purchase Details
Closed on
Apr 24, 1987
Create a Home Valuation Report for This Property
The Home Valuation Report is an in-depth analysis detailing your home's value as well as a comparison with similar homes in the area
Home Values in the Area
Average Home Value in this Area
Purchase History
| Date | Buyer | Sale Price | Title Company |
|---|---|---|---|
| Odesh Gemes | $658,500 | First American Title | |
| Williams Brian Curtis | -- | -- | |
| Williams Brian C | $260,000 | California Title Company | |
| -- | $203,700 | -- |
Source: Public Records
Mortgage History
| Date | Status | Borrower | Loan Amount |
|---|---|---|---|
| Open | Odesh Gemes | $458,500 | |
| Previous Owner | Williams Brian C | $135,000 |
Source: Public Records
Tax History Compared to Growth
Tax History
| Year | Tax Paid | Tax Assessment Tax Assessment Total Assessment is a certain percentage of the fair market value that is determined by local assessors to be the total taxable value of land and additions on the property. | Land | Improvement |
|---|---|---|---|---|
| 2025 | $10,179 | $779,521 | $306,125 | $473,396 |
| 2024 | $10,179 | $764,237 | $300,123 | $464,114 |
| 2023 | $10,702 | $749,253 | $294,239 | $455,014 |
| 2022 | $10,473 | $734,563 | $288,470 | $446,093 |
| 2021 | $9,956 | $720,161 | $282,814 | $437,347 |
| 2020 | $9,678 | $712,778 | $279,915 | $432,863 |
| 2019 | $8,530 | $698,803 | $274,427 | $424,376 |
| 2018 | $8,392 | $685,102 | $269,047 | $416,055 |
| 2017 | $8,285 | $671,670 | $263,772 | $407,898 |
| 2016 | $7,956 | $658,500 | $258,600 | $399,900 |
| 2015 | $4,149 | $345,419 | $135,650 | $209,769 |
| 2014 | $4,066 | $338,653 | $132,993 | $205,660 |
Source: Public Records
Map
Nearby Homes
- 10979 Skywood Dr
- 5346 Grandridge Rd
- 243 Horizon Hills Dr
- 182 Dewitt Ct
- 11201 Constellation Dr
- 768 E Chase Ave
- 1490 S Orange Ave Unit 117
- 1440 S Orange Ave Unit 92
- 1440 S Orange Ave Unit 105
- 1440 S Orange Ave
- 1440 S Orange Ave Unit 64
- 1440 S Orange Ave Unit 99
- 1440 S Orange Ave Unit 71
- 10880 Hess Dr
- 1135 Old Chase Ave
- 11228 Horizon Hills Dr
- 975-89 S Lincoln Ave
- 969 S Mollison Ave
- 4726 Lorena Place
- 11231 Culver Ct
- 480 Nila Ln
- 472 Nila Ln
- 1547 Avenida Arriba
- 487 Nila Ln
- 1535 Avenida Arriba
- 1563 Avenida Arriba
- 479 Nila Ln
- 1523 Avenida Arriba
- 1575 Avenida Arriba
- 1522 Avenida Arriba
- 464 Nila Ln
- 471 Nila Ln
- 486 Skywood Dr
- 478 Skywood Dr
- 465 Avenida Abajo
- 1511 Avenida Arriba
- 1587 Avenida Arriba
- 463 Nila Ln
- 456 Nila Ln
- 470 Skywood Dr