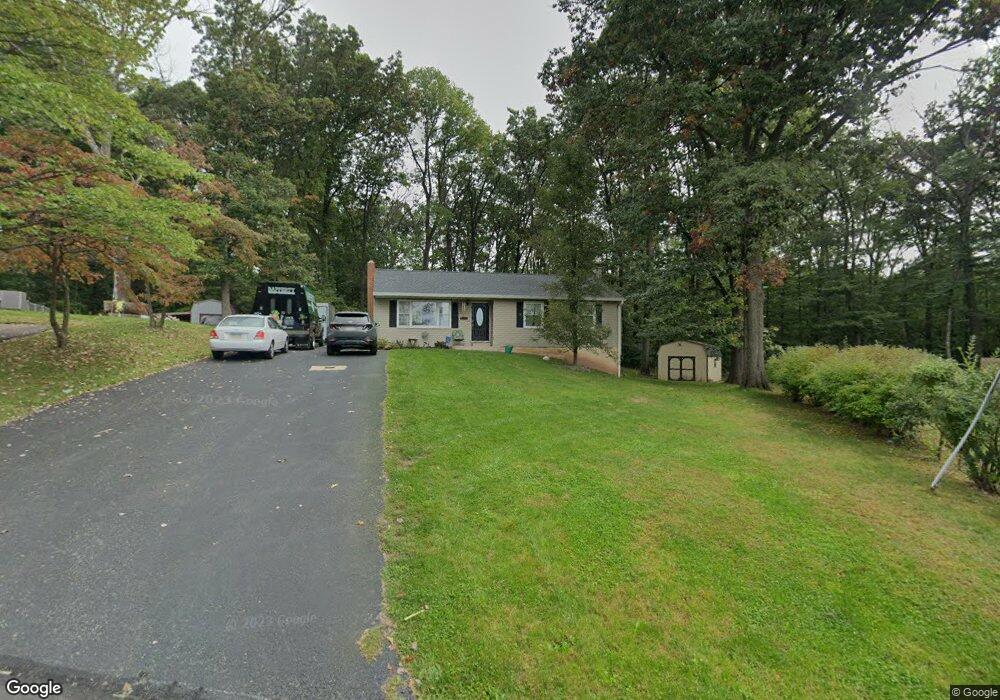
488 Spruce Rd New Cumberland, PA 17070
Estimated Value: $230,000 - $305,000
3
Beds
1
Bath
1,130
Sq Ft
$228/Sq Ft
Est. Value
About This Home
This home is located at 488 Spruce Rd, New Cumberland, PA 17070 and is currently estimated at $258,105, approximately $228 per square foot. 488 Spruce Rd is a home located in York County with nearby schools including Fishing Creek Elementary School, Crossroads Middle School, and Red Land Senior High School.
Ownership History
Date
Name
Owned For
Owner Type
Purchase Details
Closed on
Aug 14, 2009
Sold by
Lenig David E and Lenig Jacqueline A
Bought by
Stalnaker Shannan L and Stalnaker Shannon L
Current Estimated Value
Home Financials for this Owner
Home Financials are based on the most recent Mortgage that was taken out on this home.
Original Mortgage
$132,456
Outstanding Balance
$87,020
Interest Rate
5.36%
Mortgage Type
FHA
Estimated Equity
$171,085
Purchase Details
Closed on
Mar 31, 1999
Sold by
Noble Ventures
Bought by
Lenig David E and Lenig Jacqueline A
Home Financials for this Owner
Home Financials are based on the most recent Mortgage that was taken out on this home.
Original Mortgage
$80,988
Interest Rate
6.78%
Mortgage Type
VA
Purchase Details
Closed on
Feb 17, 1999
Sold by
Contimortgage Corp
Bought by
Noble Ventures
Home Financials for this Owner
Home Financials are based on the most recent Mortgage that was taken out on this home.
Original Mortgage
$80,988
Interest Rate
6.78%
Mortgage Type
VA
Create a Home Valuation Report for This Property
The Home Valuation Report is an in-depth analysis detailing your home's value as well as a comparison with similar homes in the area
Home Values in the Area
Average Home Value in this Area
Purchase History
| Date | Buyer | Sale Price | Title Company |
|---|---|---|---|
| Stalnaker Shannan L | $134,900 | None Available | |
| Lenig David E | $79,400 | -- | |
| Noble Ventures | $48,000 | -- |
Source: Public Records
Mortgage History
| Date | Status | Borrower | Loan Amount |
|---|---|---|---|
| Open | Stalnaker Shannan L | $132,456 | |
| Previous Owner | Lenig David E | $80,988 |
Source: Public Records
Tax History Compared to Growth
Tax History
| Year | Tax Paid | Tax Assessment Tax Assessment Total Assessment is a certain percentage of the fair market value that is determined by local assessors to be the total taxable value of land and additions on the property. | Land | Improvement |
|---|---|---|---|---|
| 2025 | $2,748 | $104,970 | $31,320 | $73,650 |
| 2024 | $2,602 | $104,970 | $31,320 | $73,650 |
| 2023 | $2,531 | $104,970 | $31,320 | $73,650 |
| 2022 | $2,396 | $99,680 | $31,320 | $68,360 |
| 2021 | $2,254 | $99,680 | $31,320 | $68,360 |
| 2020 | $2,227 | $99,680 | $31,320 | $68,360 |
| 2019 | $2,188 | $99,680 | $31,320 | $68,360 |
| 2018 | $2,146 | $99,680 | $31,320 | $68,360 |
| 2017 | $2,073 | $99,680 | $31,320 | $68,360 |
| 2016 | $0 | $99,680 | $31,320 | $68,360 |
| 2015 | -- | $99,680 | $31,320 | $68,360 |
| 2014 | -- | $99,680 | $31,320 | $68,360 |
Source: Public Records
Map
Nearby Homes
- 494 Old York Rd
- 452 Elder Trail
- 402 Ethan Allen Dr
- Lot 101B Elder Trail
- Lot 98 Steuben Rd
- 491 Pine Ridge Cir
- 614 Copper Cir
- LOT 1 Big Spring Rd
- LOT 2 Big Spring Rd
- 465 Pleasantview Rd
- 317 Hillcrest Dr
- 0 Thorley Rd Unit PAYK2090566
- 633 Canvasbach Dr Unit 17B
- 604 Bluebill Dr Unit 22D
- 603 Bluebill Dr Unit 21B
- 329 Hillcrest Dr
- 457 Chestnut Way
- 612 Black Powder Dr
- 615 Beinhower Rd
- 439 Shuler Rd