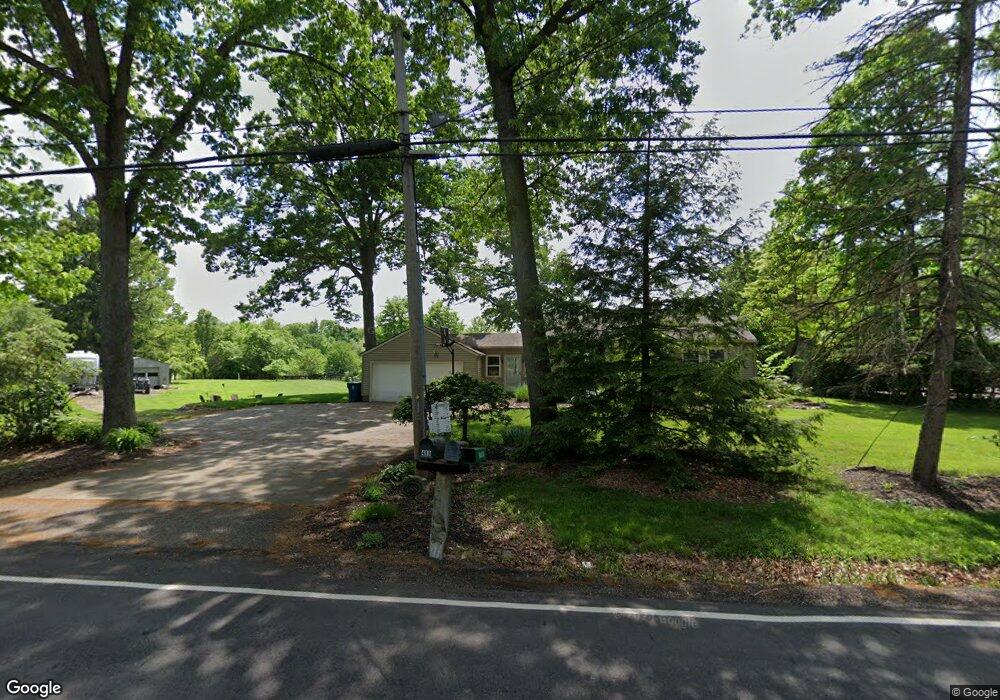
488 Yager Rd New Franklin, OH 44216
Estimated Value: $239,977 - $305,000
2
Beds
1
Bath
1,292
Sq Ft
$207/Sq Ft
Est. Value
About This Home
This home is located at 488 Yager Rd, New Franklin, OH 44216 and is currently estimated at $266,994, approximately $206 per square foot. 488 Yager Rd is a home located in Summit County with nearby schools including SS Philip and James Elementary.
Ownership History
Date
Name
Owned For
Owner Type
Purchase Details
Closed on
Oct 4, 2006
Sold by
Hutchinson T W Brady and Hutchinson Laura L
Bought by
Mccormack Chapman Susan R
Current Estimated Value
Home Financials for this Owner
Home Financials are based on the most recent Mortgage that was taken out on this home.
Original Mortgage
$160,000
Outstanding Balance
$97,308
Interest Rate
7%
Mortgage Type
Purchase Money Mortgage
Estimated Equity
$169,686
Purchase Details
Closed on
Sep 28, 1999
Sold by
Para Eileen E
Bought by
Hutchinson T W Brady and Hutchinson Laura L
Home Financials for this Owner
Home Financials are based on the most recent Mortgage that was taken out on this home.
Original Mortgage
$115,400
Interest Rate
7.93%
Create a Home Valuation Report for This Property
The Home Valuation Report is an in-depth analysis detailing your home's value as well as a comparison with similar homes in the area
Home Values in the Area
Average Home Value in this Area
Purchase History
| Date | Buyer | Sale Price | Title Company |
|---|---|---|---|
| Mccormack Chapman Susan R | $160,000 | First Security Title Corpora | |
| Hutchinson T W Brady | $121,500 | Buckeye Reserve Title Agency |
Source: Public Records
Mortgage History
| Date | Status | Borrower | Loan Amount |
|---|---|---|---|
| Open | Mccormack Chapman Susan R | $160,000 | |
| Previous Owner | Hutchinson T W Brady | $115,400 |
Source: Public Records
Tax History Compared to Growth
Tax History
| Year | Tax Paid | Tax Assessment Tax Assessment Total Assessment is a certain percentage of the fair market value that is determined by local assessors to be the total taxable value of land and additions on the property. | Land | Improvement |
|---|---|---|---|---|
| 2025 | $6,438 | $65,289 | $19,733 | $45,556 |
| 2024 | $3,268 | $65,289 | $19,733 | $45,556 |
| 2023 | $6,438 | $65,289 | $19,733 | $45,556 |
| 2022 | $3,171 | $49,336 | $14,728 | $34,608 |
| 2021 | $3,182 | $49,336 | $14,728 | $34,608 |
| 2020 | $3,127 | $49,340 | $14,730 | $34,610 |
| 2019 | $3,840 | $54,230 | $28,120 | $26,110 |
| 2018 | $3,315 | $54,230 | $28,120 | $26,110 |
| 2017 | $3,392 | $54,230 | $28,120 | $26,110 |
| 2016 | $3,352 | $50,270 | $28,120 | $22,150 |
| 2015 | $3,392 | $50,270 | $28,120 | $22,150 |
| 2014 | $3,366 | $50,270 | $28,120 | $22,150 |
| 2013 | $3,345 | $50,270 | $28,120 | $22,150 |
Source: Public Records
Map
Nearby Homes
- 451 Yager Rd
- 6407 Southview Dr
- 899 Loway Dr
- 0 W Comet Rd Unit 5079117
- 7060 Manchester Rd
- 5776 Harter Home Dr
- 6090 Manchester Rd Unit 6096
- 6387 Hampsher Rd
- 781 Leeman Dr
- 1062 Stump Rd
- 715 Highland Park Dr
- 11391 Michelle Dr NW
- 0 Babst Ave NW
- 427 Center Rd
- 8714 Greenmeadow Ave NW
- 5892 Woodward Dr
- 8470 Shadyview Ave NW
- S/L 14,15 Shakes Hotel Dr
- 4944 Coleman Dr
- 6 Shrakes Hotel Dr