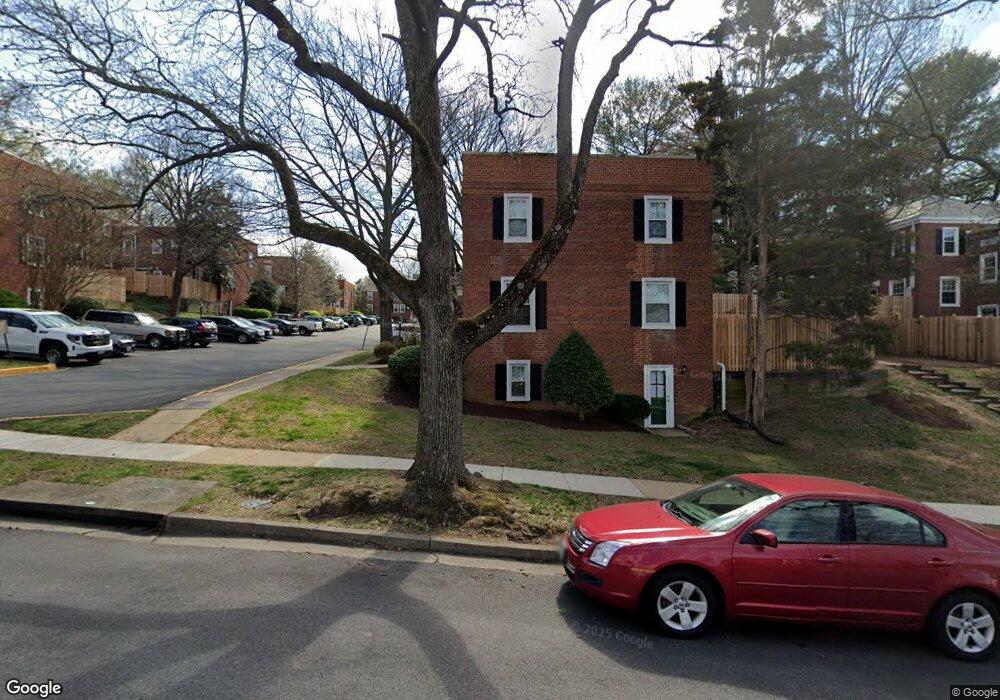
4882 28th St S Unit A Arlington, VA 22206
Fairlington NeighborhoodEstimated Value: $545,826 - $607,000
2
Beds
2
Baths
1,383
Sq Ft
$410/Sq Ft
Est. Value
About This Home
This home is located at 4882 28th St S Unit A, Arlington, VA 22206 and is currently estimated at $567,457, approximately $410 per square foot. 4882 28th St S Unit A is a home located in Arlington County with nearby schools including Abingdon Elementary School, Gunston Middle School, and Wakefield High School.
Ownership History
Date
Name
Owned For
Owner Type
Purchase Details
Closed on
Apr 12, 2022
Sold by
Snedeker Thomas C
Bought by
Snedeker Thomas Clifford
Current Estimated Value
Home Financials for this Owner
Home Financials are based on the most recent Mortgage that was taken out on this home.
Original Mortgage
$292,000
Outstanding Balance
$230,844
Interest Rate
3.01%
Mortgage Type
New Conventional
Estimated Equity
$336,613
Purchase Details
Closed on
Feb 3, 1998
Sold by
Sheehan John J
Bought by
Snedeker Thomas C
Home Financials for this Owner
Home Financials are based on the most recent Mortgage that was taken out on this home.
Original Mortgage
$139,000
Interest Rate
7.02%
Mortgage Type
New Conventional
Purchase Details
Closed on
Apr 3, 1995
Sold by
Cobble Carol E
Bought by
Sheehan John J
Home Financials for this Owner
Home Financials are based on the most recent Mortgage that was taken out on this home.
Original Mortgage
$85,000
Interest Rate
8.8%
Create a Home Valuation Report for This Property
The Home Valuation Report is an in-depth analysis detailing your home's value as well as a comparison with similar homes in the area
Home Values in the Area
Average Home Value in this Area
Purchase History
| Date | Buyer | Sale Price | Title Company |
|---|---|---|---|
| Snedeker Thomas Clifford | -- | None Listed On Document | |
| Snedeker Thomas C | $149,000 | -- | |
| Sheehan John J | $135,250 | -- |
Source: Public Records
Mortgage History
| Date | Status | Borrower | Loan Amount |
|---|---|---|---|
| Open | Snedeker Thomas Clifford | $292,000 | |
| Previous Owner | Sheehan John J | $139,000 | |
| Previous Owner | Sheehan John J | $85,000 |
Source: Public Records
Tax History
| Year | Tax Paid | Tax Assessment Tax Assessment Total Assessment is a certain percentage of the fair market value that is determined by local assessors to be the total taxable value of land and additions on the property. | Land | Improvement |
|---|---|---|---|---|
| 2025 | $5,801 | $561,600 | $53,500 | $508,100 |
| 2024 | $5,340 | $516,900 | $53,500 | $463,400 |
| 2023 | $5,324 | $516,900 | $53,500 | $463,400 |
| 2022 | $5,233 | $508,100 | $53,500 | $454,600 |
| 2021 | $5,018 | $487,200 | $48,200 | $439,000 |
| 2020 | $4,678 | $455,900 | $48,200 | $407,700 |
| 2019 | $4,375 | $426,400 | $44,300 | $382,100 |
| 2018 | $4,182 | $415,700 | $44,300 | $371,400 |
| 2017 | $4,077 | $405,300 | $44,300 | $361,000 |
| 2016 | $3,983 | $401,900 | $44,300 | $357,600 |
| 2015 | $4,037 | $405,300 | $44,300 | $361,000 |
| 2014 | $4,037 | $405,300 | $44,300 | $361,000 |
Source: Public Records
Map
Nearby Homes
- 4849 28th St S Unit B
- 4829 28th St S Unit A
- 4862 28th St S Unit A1
- 2813 S Columbus St
- 2825 S Columbus St
- 2856 S Buchanan St Unit B1
- 2814 S Columbus St
- 2406 S Dinwiddie St
- 5021 24th St S
- 3200 S 28th St Unit 403
- 2932 S Columbus St Unit A2
- 2906 S Buchanan St
- 2544 S Walter Reed Dr Unit B
- 3320 S 28th St Unit 403
- 4617 28th Rd S Unit B
- 3101 N Hampton Dr Unit 718
- 3101 N Hampton Dr Unit 1014
- 3101 N Hampton Dr Unit 1614
- 3101 N Hampton Dr Unit 1319
- 3101 N Hampton Dr Unit 608
- 4882 28th St S Unit B
- 4880 28th St S Unit B
- 4880 28th St S Unit A
- 4886 28th St S Unit A
- 4886 28th St S Unit B
- 4884 28th St S Unit B
- 4884 28th St S Unit A
- 4842 28th St S Unit B
- 4842 28th St S Unit A
- 4878 28th St S Unit C2
- 4878 28th St S Unit C1
- 4878 28th St S Unit B2
- 4878 28th St S Unit A2
- 4878 28th St S Unit B1
- 4878 28th St S Unit A1
- 4838 S 28th St S Unit A-=2
- 4840 28th St S Unit A
- 4840 28th St S Unit B
- 4840 28th St S Unit A
- 4844 28th St S Unit B
Your Personal Tour Guide
Ask me questions while you tour the home.