Estimated Value: $767,267 - $1,001,000
4
Beds
5
Baths
3,426
Sq Ft
$260/Sq Ft
Est. Value
About This Home
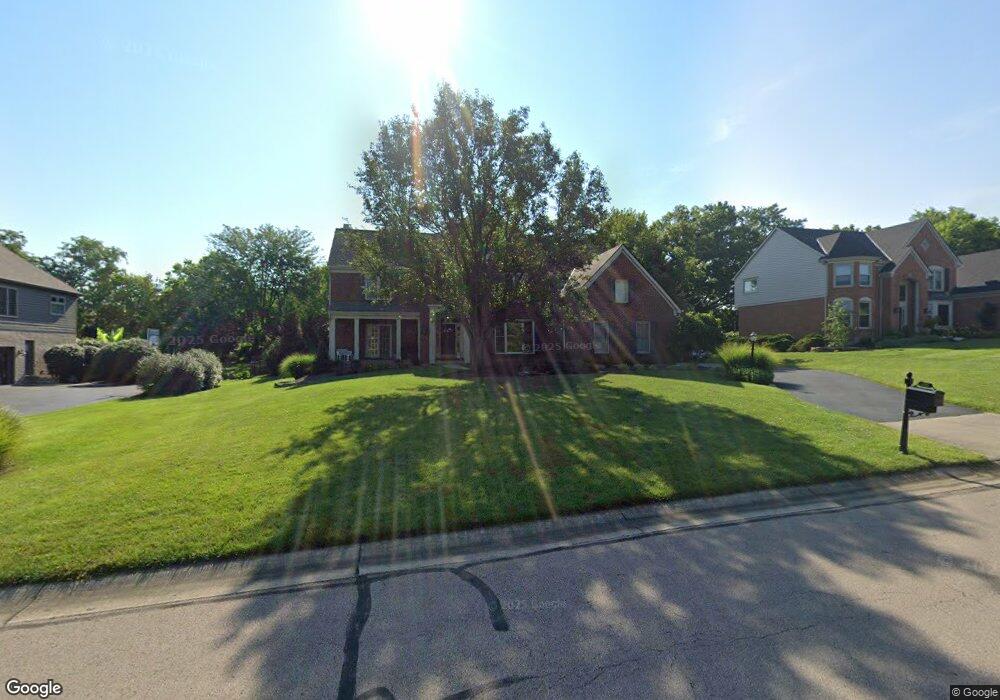
This home is located at 4882 Colt Ln, Mason, OH 45040 and is currently estimated at $891,067, approximately $260 per square foot. 4882 Colt Ln is a home located in Warren County with nearby schools including Mason Intermediate Elementary School, Mason Middle School, and William Mason High School.
Ownership History
Date
Name
Owned For
Owner Type
Purchase Details
Closed on
Apr 9, 2001
Sold by
Gilson David C
Bought by
Steinacker Jeffry J and Steinacker Maureen A
Current Estimated Value
Purchase Details
Closed on
Sep 9, 1998
Sold by
Camden Homes Inc
Bought by
Gilson David C and Gilson Lind L
Home Financials for this Owner
Home Financials are based on the most recent Mortgage that was taken out on this home.
Original Mortgage
$200,000
Interest Rate
7.06%
Mortgage Type
New Conventional
Purchase Details
Closed on
Oct 7, 1997
Sold by
Heritage Club Ltd
Bought by
Camdem Homes Inc
Home Financials for this Owner
Home Financials are based on the most recent Mortgage that was taken out on this home.
Original Mortgage
$336,000
Interest Rate
7.54%
Mortgage Type
New Conventional
Create a Home Valuation Report for This Property
The Home Valuation Report is an in-depth analysis detailing your home's value as well as a comparison with similar homes in the area
Home Values in the Area
Average Home Value in this Area
Purchase History
| Date | Buyer | Sale Price | Title Company |
|---|---|---|---|
| Steinacker Jeffry J | $405,000 | -- | |
| Gilson David C | $450,000 | -- | |
| Camdem Homes Inc | $78,750 | -- |
Source: Public Records
Mortgage History
| Date | Status | Borrower | Loan Amount |
|---|---|---|---|
| Previous Owner | Gilson David C | $200,000 | |
| Previous Owner | Camdem Homes Inc | $336,000 | |
| Closed | Steinacker Jeffry J | -- |
Source: Public Records
Tax History Compared to Growth
Tax History
| Year | Tax Paid | Tax Assessment Tax Assessment Total Assessment is a certain percentage of the fair market value that is determined by local assessors to be the total taxable value of land and additions on the property. | Land | Improvement |
|---|---|---|---|---|
| 2024 | $7,778 | $191,640 | $35,000 | $156,640 |
| 2023 | $7,828 | $162,953 | $32,445 | $130,508 |
| 2022 | $7,727 | $162,953 | $32,445 | $130,508 |
| 2021 | $7,320 | $162,953 | $32,445 | $130,508 |
| 2020 | $8,289 | $158,207 | $31,500 | $126,707 |
| 2019 | $7,620 | $158,207 | $31,500 | $126,707 |
| 2018 | $7,646 | $158,207 | $31,500 | $126,707 |
| 2017 | $7,950 | $153,577 | $31,073 | $122,504 |
| 2016 | $8,189 | $153,577 | $31,073 | $122,504 |
| 2015 | $8,206 | $153,577 | $31,073 | $122,504 |
| 2014 | $4,191 | $146,260 | $29,590 | $116,670 |
| 2013 | $8,399 | $172,990 | $35,000 | $137,990 |
Source: Public Records
Map
Nearby Homes
- 5088 Harvestdale Dr
- 5017 Ainsley Dr
- 5864 Grazing Ct
- 4874 Shagbark Ct
- 5280 Sunset Ridge Dr
- 5662 Hawthorn Ct
- 6329 Caddies Way
- 4253 Maxwell Dr
- 4319 Serpentine Way
- 5513 Harvestdale Dr
- 4109 Maxwell Dr
- 4576 Meadowbrook Ln
- Vanderburgh Plan at Ivy Lane
- Belleville Plan at Ivy Lane
- Buchanan Plan at Ivy Lane
- Alden Plan at Ivy Lane
- Naples Plan at Ivy Lane
- Quentin Plan at Ivy Lane
- Hialeah Plan at Ivy Lane
- Ashton Plan at Ivy Lane
- 4902 Colt Ln
- 4858 Colt Ln
- 4924 Colt Ln
- 4778 Tillinghast Ct
- 4899 Braid Ln Unit 240
- 4899 Braid Ln
- 4863 Colt Ln
- 4877 Braid Ln
- 4913 Colt Ln
- 4925 Braid Ln
- 4950 Colt Ln
- 4842 Tillinghast Ct
- 4851 Braid Ln
- 4957 Braid Ln
- 4770 Tillinghast Ct
- 4953 Colt Ln
- 4868 Tillinghast Ct
- 4980 Colt Ln
- 4981 Braid Ln
- 4870 Braid Ln