4883 E Butler Ave Unit 102 Fresno, CA 93727
Sunnyside NeighborhoodEstimated Value: $163,000 - $215,000
2
Beds
2
Baths
1,416
Sq Ft
$134/Sq Ft
Est. Value
About This Home
This home is located at 4883 E Butler Ave Unit 102, Fresno, CA 93727 and is currently estimated at $190,169, approximately $134 per square foot. 4883 E Butler Ave Unit 102 is a home located in Fresno County with nearby schools including Ayer Elementary School, Elizabeth Terronez Middle School, and Sunnyside High School.
Ownership History
Date
Name
Owned For
Owner Type
Purchase Details
Closed on
May 22, 2015
Sold by
Eland Carol A
Bought by
Eland Carol and Carol A Eland Living Trust
Current Estimated Value
Purchase Details
Closed on
Jan 30, 2009
Sold by
Hsbc Bank Usa Na
Bought by
Eland John and Eland Carol
Purchase Details
Closed on
Dec 5, 2008
Sold by
Suarez Lorenzo and Suarez Maria Paz
Bought by
Hsbc Bank Usa Na
Purchase Details
Closed on
Nov 29, 2005
Sold by
Peyton Patrick and Peyton Kerry J
Bought by
Suarez Lorenzo and Suarez Maria Paz
Home Financials for this Owner
Home Financials are based on the most recent Mortgage that was taken out on this home.
Original Mortgage
$185,000
Interest Rate
6.95%
Mortgage Type
Purchase Money Mortgage
Purchase Details
Closed on
Oct 13, 1995
Sold by
Peyton Kerry J and Garza Kerry J
Bought by
Peyton Kerry J and Peyton Patrick
Create a Home Valuation Report for This Property
The Home Valuation Report is an in-depth analysis detailing your home's value as well as a comparison with similar homes in the area
Home Values in the Area
Average Home Value in this Area
Purchase History
| Date | Buyer | Sale Price | Title Company |
|---|---|---|---|
| Eland Carol | -- | None Available | |
| Eland John | $67,000 | Orange Coast Title | |
| Hsbc Bank Usa Na | $193,767 | Accommodation | |
| Suarez Lorenzo | $185,000 | Stewart Title Of Fresno Cnty | |
| Peyton Kerry J | -- | -- |
Source: Public Records
Mortgage History
| Date | Status | Borrower | Loan Amount |
|---|---|---|---|
| Previous Owner | Suarez Lorenzo | $185,000 |
Source: Public Records
Tax History Compared to Growth
Tax History
| Year | Tax Paid | Tax Assessment Tax Assessment Total Assessment is a certain percentage of the fair market value that is determined by local assessors to be the total taxable value of land and additions on the property. | Land | Improvement |
|---|---|---|---|---|
| 2025 | $1,104 | $86,261 | $21,882 | $64,379 |
| 2023 | $1,083 | $82,913 | $21,033 | $61,880 |
| 2022 | $1,069 | $81,288 | $20,621 | $60,667 |
| 2021 | $1,040 | $79,695 | $20,217 | $59,478 |
| 2020 | $1,035 | $78,879 | $20,010 | $58,869 |
| 2019 | $997 | $77,333 | $19,618 | $57,715 |
| 2018 | $975 | $75,818 | $19,234 | $56,584 |
| 2017 | $905 | $70,000 | $17,000 | $53,000 |
| 2016 | $893 | $70,000 | $17,000 | $53,000 |
| 2015 | $892 | $70,000 | $17,000 | $53,000 |
| 2014 | -- | $65,000 | $16,000 | $49,000 |
Source: Public Records
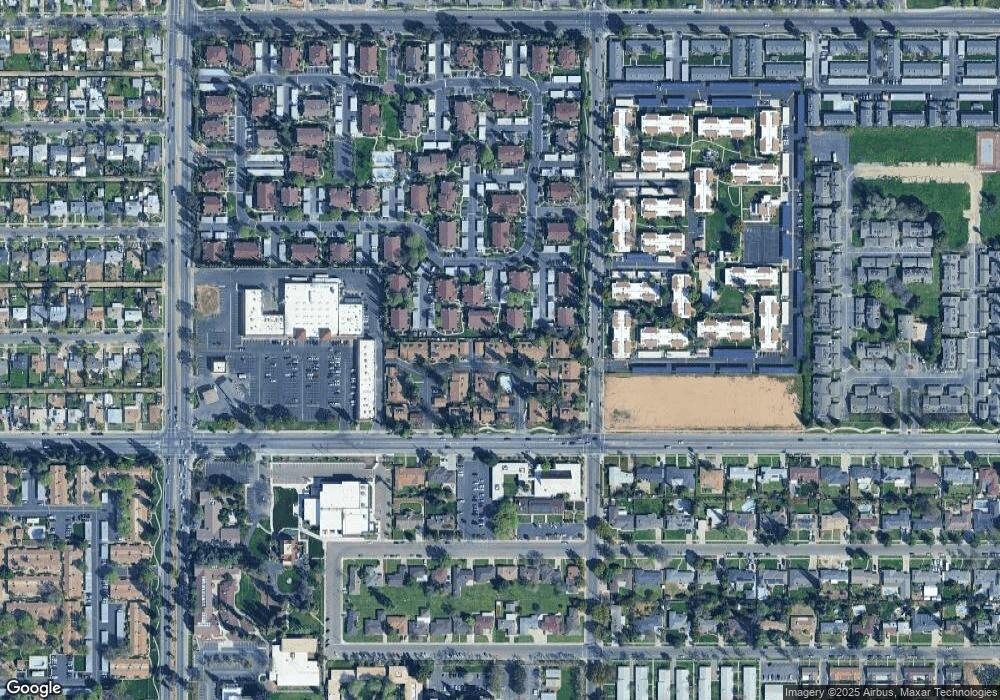
Map
Nearby Homes
- 4871 E Butler Ave Unit 102
- 1190 S Winery Ave Unit 284
- 1151 S Chestnut Ave Unit 127
- 1151 S Chestnut Ave Unit 215
- 1151 S Chestnut Ave Unit 108
- 4975 E Butler Ave Unit 131
- 4985 E Butler Ave Unit 109
- 5023 E Lane Ave
- 4749 E Montecito Ave
- 1838 S Whitney Ave
- 4756 E Woodward Ave
- 2123 S Winery Ave
- 1852 S Baird Ct
- 4883 E Geary St
- 4831 E Geary St
- 4629 E Alta Ave
- 4615 E Hamilton Ave
- 5145 E Lane Ave Unit 252
- 5125 E Audrie Ave
- 2317 S Chestnut Ave Unit 76
- 4883 E Butler Ave Unit 103
- 4883 E Butler Ave Unit 101
- 4881 E Butler Ave
- 4881 E Butler Ave Unit 103
- 4881 E Butler Ave Unit 102
- 4881 E Butler Ave Unit 101
- 4885 E Butler Ave
- 4885 E Butler Ave Unit 103
- 4885 E Butler Ave Unit 102
- 4885 E Butler Ave Unit 101
- 4875 E Butler Ave Unit 103
- 4875 E Butler Ave Unit 101
- 4875 E Butler Ave Unit 102
- 4873 E Butler Ave Unit 103
- 4873 E Butler Ave Unit 102
- 4873 E Butler Ave Unit 101
- 4879 E Butler Ave Unit 101
- 4879 E Butler Ave Unit 102
- 4879 E Butler Ave Unit 103
- 1306 S Winery Ave Unit 102