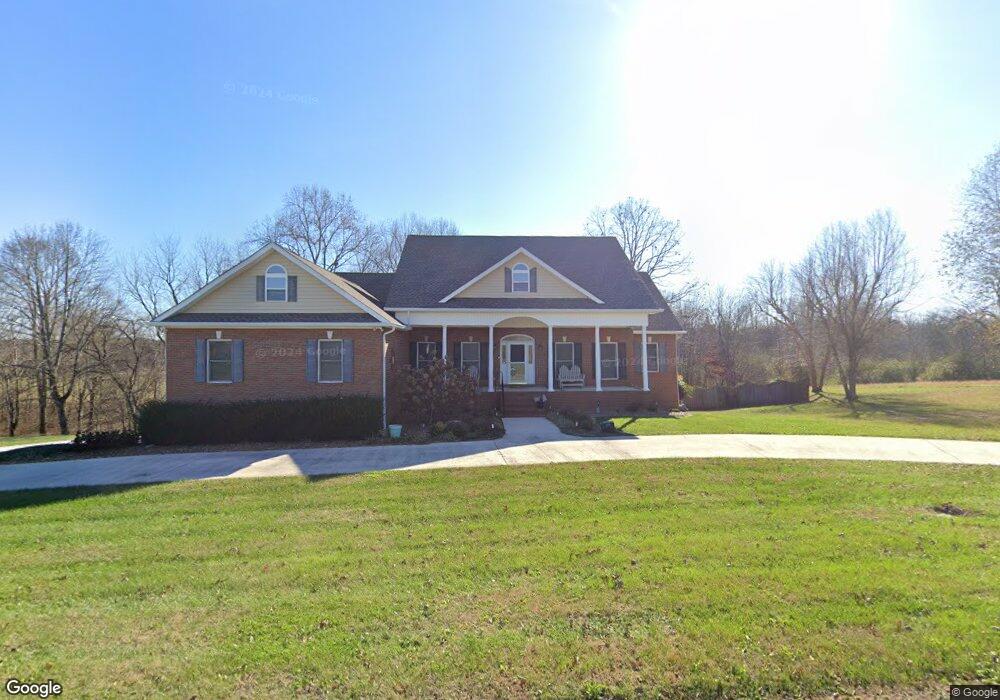
4883 Skyview Dr Cookeville, TN 38501
Estimated Value: $481,757 - $799,000
4
Beds
4
Baths
3,790
Sq Ft
$164/Sq Ft
Est. Value
About This Home
This home is located at 4883 Skyview Dr, Cookeville, TN 38501 and is currently estimated at $622,689, approximately $164 per square foot. 4883 Skyview Dr is a home located in Putnam County with nearby schools including Cane Creek Elementary School, Upperman Middle School, and Upperman High School.
Ownership History
Date
Name
Owned For
Owner Type
Purchase Details
Closed on
Aug 22, 2011
Sold by
Hitt Maureen
Bought by
Jacobson Eric R
Current Estimated Value
Home Financials for this Owner
Home Financials are based on the most recent Mortgage that was taken out on this home.
Original Mortgage
$324,929
Outstanding Balance
$224,557
Interest Rate
4.53%
Mortgage Type
Commercial
Estimated Equity
$398,132
Purchase Details
Closed on
May 17, 2005
Sold by
Wright Phillip J
Bought by
Maureen Hitt
Purchase Details
Closed on
Jul 9, 2002
Sold by
Mcwilliams James B
Bought by
Wright Phillip J and Wright Jana C
Purchase Details
Closed on
Sep 17, 2001
Sold by
Joseph Romain N
Bought by
Mcwilliams James B and Mcwilliams Adelh
Purchase Details
Closed on
Apr 25, 2000
Sold by
Whitson Cecil I
Bought by
Joseph Romain N
Purchase Details
Closed on
Nov 17, 1991
Bought by
Whitson Cecil I
Purchase Details
Closed on
Nov 20, 1981
Bought by
Whitson Cecil T
Purchase Details
Closed on
Oct 10, 1970
Create a Home Valuation Report for This Property
The Home Valuation Report is an in-depth analysis detailing your home's value as well as a comparison with similar homes in the area
Home Values in the Area
Average Home Value in this Area
Purchase History
| Date | Buyer | Sale Price | Title Company |
|---|---|---|---|
| Jacobson Eric R | $324,929 | -- | |
| Maureen Hitt | $290,000 | -- | |
| Wright Phillip J | $32,500 | -- | |
| Mcwilliams James B | $29,900 | -- | |
| Joseph Romain N | $24,500 | -- | |
| Whitson Cecil I | -- | -- | |
| Whitson Cecil T | -- | -- | |
| -- | -- | -- |
Source: Public Records
Mortgage History
| Date | Status | Borrower | Loan Amount |
|---|---|---|---|
| Open | Jacobson Eric R | $324,929 | |
| Previous Owner | Not Available | $232,000 |
Source: Public Records
Tax History Compared to Growth
Tax History
| Year | Tax Paid | Tax Assessment Tax Assessment Total Assessment is a certain percentage of the fair market value that is determined by local assessors to be the total taxable value of land and additions on the property. | Land | Improvement |
|---|---|---|---|---|
| 2024 | $2,556 | $96,100 | $13,125 | $82,975 |
| 2023 | $2,556 | $96,100 | $13,125 | $82,975 |
| 2022 | $2,376 | $96,100 | $13,125 | $82,975 |
| 2021 | $2,376 | $96,100 | $13,125 | $82,975 |
| 2020 | $2,404 | $96,100 | $13,125 | $82,975 |
| 2019 | $2,243 | $82,175 | $13,125 | $69,050 |
| 2018 | $2,093 | $76,650 | $13,125 | $63,525 |
| 2017 | $2,093 | $76,650 | $13,125 | $63,525 |
| 2016 | $2,093 | $76,650 | $13,125 | $63,525 |
| 2015 | $2,150 | $76,650 | $13,125 | $63,525 |
| 2014 | $2,055 | $73,273 | $0 | $0 |
Source: Public Records
Map
Nearby Homes
- 1764 Bouton Dr
- 2312 Benjy Cir
- 3815 Spurgeon Dr
- 1920 Clemmons Rd
- 1711 Creekside Dr
- 1775 Creekside Dr
- 2269 Plunk Whitson Rd
- 2618 Whispering Oak Ln
- 2450 Whispering Oaks Ln
- 3709 Poundstone Dr
- 2694 Whispering Oaks Ln
- 2600 Whispering Oaks Ln
- 2636 Whispering Oaks Ln
- 4763 Cumby Rd
- 2870 Autumn Woods Trail
- 918 Faye Dr
- 2895 Autumn Woods Trail
- 4028 Winter Haven Dr
- 2617 Spring Arbor Ct
- 2770 Autumn Woods Trail
- 4882 Skyview Dr
- 4874 Skyview Dr
- 4891 Skyview Dr
- 4890 Skyview Dr
- 1771 Bouton Dr
- 1775 Bouton Dr
- 1767 Bouton Dr
- 4856 Skyview Dr
- 1763 Bouton Dr
- 1779 Bouton Dr
- 1778 Bouton Dr
- 4848 Skyview Dr
- 1759 Bouton Dr
- 1783 Bouton Dr
- 1755 Bouton Dr
- 1530 Blackburn Fork Rd
- 4849 Skyview Dr
- 1782 Bouton Dr
- 1752 Bouton Dr
- 4840 Skyview Dr