4883 Township Line Rd Coldwater, OH 45828
Estimated Value: $270,518 - $394,000
3
Beds
2
Baths
1,802
Sq Ft
$181/Sq Ft
Est. Value
About This Home
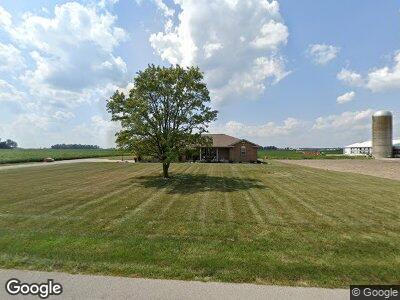
This home is located at 4883 Township Line Rd, Coldwater, OH 45828 and is currently estimated at $325,880, approximately $180 per square foot. 4883 Township Line Rd is a home located in Mercer County with nearby schools including Coldwater Elementary School, Coldwater Middle School, and Coldwater High School.
Ownership History
Date
Name
Owned For
Owner Type
Purchase Details
Closed on
Aug 18, 2021
Sold by
Siefring Neil J and Siefring Mary K
Bought by
Siefring Mitchell J
Current Estimated Value
Home Financials for this Owner
Home Financials are based on the most recent Mortgage that was taken out on this home.
Original Mortgage
$140,000
Outstanding Balance
$129,210
Interest Rate
2.9%
Mortgage Type
New Conventional
Estimated Equity
$163,589
Purchase Details
Closed on
Feb 6, 2014
Sold by
Siefring Lois A
Bought by
Siefring Neil J and Siefring Mary K
Purchase Details
Closed on
Feb 4, 2014
Sold by
Siefring Neil J and Siefring Ronald J
Bought by
Siefring Neil J and Siefring Mary K
Purchase Details
Closed on
Jan 27, 2014
Sold by
Estate Of Greg A Siefring
Bought by
Siefring Lois A and Greg A Siefring Revocable Living Trust
Create a Home Valuation Report for This Property
The Home Valuation Report is an in-depth analysis detailing your home's value as well as a comparison with similar homes in the area
Home Values in the Area
Average Home Value in this Area
Purchase History
| Date | Buyer | Sale Price | Title Company |
|---|---|---|---|
| Siefring Mitchell J | $175,000 | None Available | |
| Siefring Neil J | $63,000 | Attorney | |
| Siefring Neil J | $126,000 | Attorney | |
| Siefring Lois A | -- | None Available |
Source: Public Records
Mortgage History
| Date | Status | Borrower | Loan Amount |
|---|---|---|---|
| Open | Siefring Mitchell J | $140,000 |
Source: Public Records
Tax History Compared to Growth
Tax History
| Year | Tax Paid | Tax Assessment Tax Assessment Total Assessment is a certain percentage of the fair market value that is determined by local assessors to be the total taxable value of land and additions on the property. | Land | Improvement |
|---|---|---|---|---|
| 2024 | $2,936 | $86,730 | $10,010 | $76,720 |
| 2023 | $2,936 | $86,730 | $10,010 | $76,720 |
| 2022 | $2,668 | $71,120 | $6,370 | $64,750 |
| 2021 | $2,683 | $71,120 | $6,370 | $64,750 |
| 2020 | $1,279 | $71,120 | $6,370 | $64,750 |
| 2019 | $2,403 | $64,650 | $5,780 | $58,870 |
| 2018 | $2,393 | $64,650 | $5,780 | $58,870 |
| 2017 | $2,416 | $64,650 | $5,780 | $58,870 |
| 2016 | $2,434 | $64,510 | $5,670 | $58,840 |
| 2015 | $2,354 | $64,510 | $5,670 | $58,840 |
| 2014 | $2,308 | $64,510 | $5,670 | $58,840 |
| 2013 | $2,367 | $59,710 | $5,250 | $54,460 |
Source: Public Records
Map
Nearby Homes
- 5890 Karch Rd
- 5220 Philothea Rd
- 1024 Coletta Ct
- 5514 Ohio 118
- 117 S 7th St
- 0 Coletta Ct Unit 24/1807 1032998
- 0 Coletta Ct Unit 23/1806 1032997
- 0 Coletta Ct Unit 21/1804 1032996
- 0 Coletta Ct Unit 16/1799 1032995
- 4978 Buschor Rd
- 0 Eaglebrooke Unit 216 1034030
- 0 Eaglebrooke Unit 215 1034029
- 0 Eaglebrooke Unit 214 1034028
- 0 Havemann Unit 1025458
- 0 Anderson Lots 10 11 & 12 Ln Unit 1037885
- 0 Springer 1-6 & Roadway 14-16 Unit 1037883
- 0 Anderson 13&14 & Roadway 12&13 Unit 1037886
- 1429 State Route 29
- 4507 Coldwater Creek Rd
- 4477 Mud Pike Rd
- 4883 Township Line Rd
- 4870 Township Line Rd
- 4840 Township Line Rd
- 4828 Township Line Rd
- 4782 Township Line Rd
- 4782 Township Line Rd
- 4800 Township Line Rd
- 4759 Township Line Rd
- 3023 Slavik Rd
- 3065 Slavik Rd
- 3085 Slavik Rd
- 3109 Slavik Rd
- 3192 Slavik Rd
- 5071 Township Line Rd
- 3112 Slavik Rd
- 3175 Slavik Rd
- 3196 Slavik Rd
- 3207 Slavik Rd
- 5170 Township Line Rd
- 3215 Menchhofer Rd