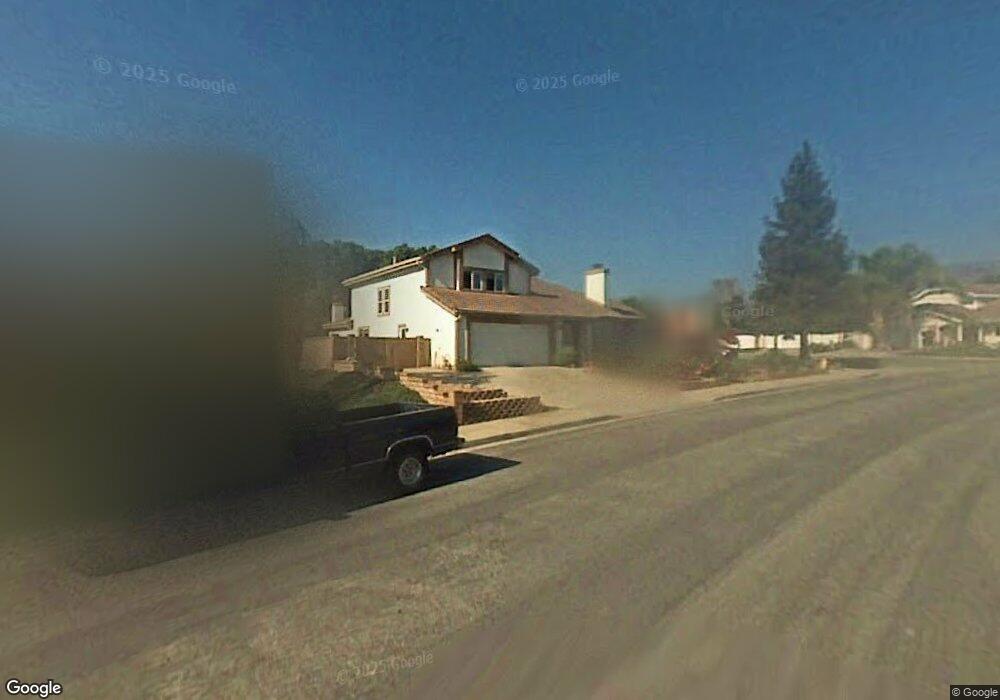
4883 Via Alista La Verne, CA 91750
North La Verne NeighborhoodEstimated Value: $1,177,000 - $1,378,000
4
Beds
3
Baths
2,037
Sq Ft
$631/Sq Ft
Est. Value
About This Home
This home is located at 4883 Via Alista, La Verne, CA 91750 and is currently estimated at $1,285,166, approximately $630 per square foot. 4883 Via Alista is a home located in Los Angeles County with nearby schools including La Verne Heights Elementary School, Ramona Middle School, and Bonita High School.
Ownership History
Date
Name
Owned For
Owner Type
Purchase Details
Closed on
Feb 21, 2023
Sold by
Nottingham Ronald and Nottingham Marilyn
Bought by
Pan Jin and Shi Xiaoqing
Current Estimated Value
Purchase Details
Closed on
Mar 26, 2013
Sold by
Hageman Frank Fetze and Hageman Suzy Grace
Bought by
Hageman Frank Fetze and Hageman Suzy Grace
Purchase Details
Closed on
May 26, 2012
Sold by
Hageman Frank K Fetze and Hageman Suzy Grace
Bought by
Hageman Frank Fetze and Hageman Suzy Grace
Home Financials for this Owner
Home Financials are based on the most recent Mortgage that was taken out on this home.
Original Mortgage
$186,000
Interest Rate
3.77%
Mortgage Type
New Conventional
Purchase Details
Closed on
Feb 3, 2006
Sold by
Hageman Frank Fetze and Hageman Suzy Grace
Bought by
Hageman Frank Fetze and Hageman Suzy Grace
Create a Home Valuation Report for This Property
The Home Valuation Report is an in-depth analysis detailing your home's value as well as a comparison with similar homes in the area
Home Values in the Area
Average Home Value in this Area
Purchase History
| Date | Buyer | Sale Price | Title Company |
|---|---|---|---|
| Pan Jin | $1,394,818 | First American Title | |
| Hageman Frank Fetze | -- | None Available | |
| Hageman Frank Fetze | -- | First American Title Ins Co | |
| Hageman Frank Fetze | -- | None Available |
Source: Public Records
Mortgage History
| Date | Status | Borrower | Loan Amount |
|---|---|---|---|
| Previous Owner | Hageman Frank Fetze | $186,000 |
Source: Public Records
Tax History Compared to Growth
Tax History
| Year | Tax Paid | Tax Assessment Tax Assessment Total Assessment is a certain percentage of the fair market value that is determined by local assessors to be the total taxable value of land and additions on the property. | Land | Improvement |
|---|---|---|---|---|
| 2025 | $5,335 | $423,428 | $124,240 | $299,188 |
| 2024 | $5,335 | $415,126 | $121,804 | $293,322 |
| 2023 | $5,211 | $406,987 | $119,416 | $287,571 |
| 2022 | $5,128 | $399,008 | $117,075 | $281,933 |
| 2021 | $5,023 | $391,185 | $114,780 | $276,405 |
| 2019 | $4,927 | $379,584 | $111,377 | $268,207 |
| 2018 | $4,633 | $372,143 | $109,194 | $262,949 |
| 2016 | $4,442 | $357,694 | $104,954 | $252,740 |
| 2015 | $4,286 | $344,363 | $103,378 | $240,985 |
| 2014 | $4,248 | $337,618 | $101,353 | $236,265 |
Source: Public Records
Map
Nearby Homes
- 1355 Aldersgate Dr
- 2516 Baseline Rd
- 1937 Citruswood St
- 4805 Chamber Ave
- 4700 Emerald Ave
- 5905 Old Wheeler Rd
- 15 Yucca Ct Unit 15
- 1638 Larch Place
- 918 Sequoia Ct
- 3888 Chelsea Dr
- 6051 Via Entrada
- 2040 Whitebluff Dr
- 5996 Birdie Dr
- 1752 Grasscreek Dr
- 1753 Eaton Place
- 1979 Fernridge Dr
- 3537 Damien Ave
- 4095 Fruit St Unit Spc 328
- 4095 Fruit St Unit 607
- 4095 Fruit St Unit 108
- 4875 Via Alista
- 1432 Via Corta
- 1416 Via Corta
- 1417 Calle Clemente
- 4863 Via Alista
- 4894 Via Alista
- 4880 Via Alista
- 1425 Calle Clemente
- 1413 Via Corta
- 1441 Via Corta
- 1409 Calle Clemente
- 4872 Via Alista
- 4910 Via Alista
- 1427 Via Corta
- 1437 Calle Clemente
- 4838 Wheeler Ave
- 4851 Via Alista
- 4822 Wheeler Ave
- 4850 Wheeler Ave
- 4860 Via Alista