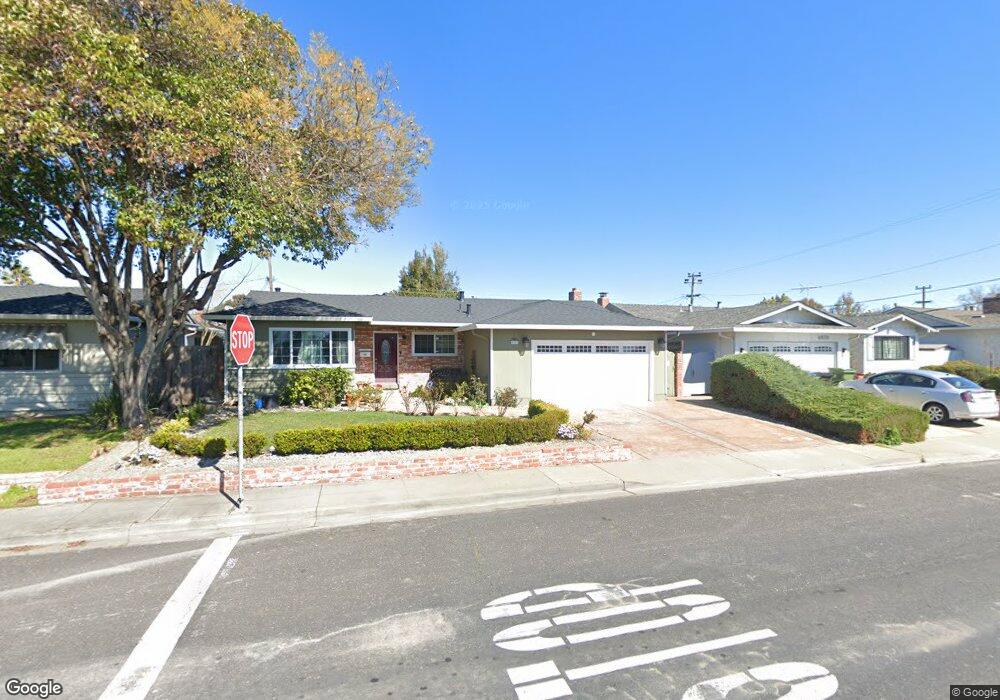
4885 Valpey Park Ave Fremont, CA 94538
Blacow NeighborhoodEstimated Value: $1,472,000 - $1,690,000
4
Beds
2
Baths
1,551
Sq Ft
$1,011/Sq Ft
Est. Value
About This Home
This home is located at 4885 Valpey Park Ave, Fremont, CA 94538 and is currently estimated at $1,567,742, approximately $1,010 per square foot. 4885 Valpey Park Ave is a home located in Alameda County with nearby schools including Steven Millard Elementary, G.M. Walters Middle School, and John F. Kennedy High School.
Ownership History
Date
Name
Owned For
Owner Type
Purchase Details
Closed on
Sep 16, 2019
Sold by
Chaurasia Avinash and Bhagat Sneha
Bought by
Chaurasia Avinash and Bhagat Sneha
Current Estimated Value
Purchase Details
Closed on
Jan 22, 2013
Sold by
Herrera Michele M
Bought by
Chaurasia Avinash and Bhagat Sneha
Home Financials for this Owner
Home Financials are based on the most recent Mortgage that was taken out on this home.
Original Mortgage
$352,000
Outstanding Balance
$243,714
Interest Rate
3.28%
Mortgage Type
New Conventional
Estimated Equity
$1,324,028
Purchase Details
Closed on
Jul 23, 2001
Sold by
Herrera Ricardo C
Bought by
Herrera Michele M
Home Financials for this Owner
Home Financials are based on the most recent Mortgage that was taken out on this home.
Original Mortgage
$215,000
Interest Rate
7.15%
Purchase Details
Closed on
May 28, 1997
Sold by
Herrera Ricardo C
Bought by
Herrera Michele
Create a Home Valuation Report for This Property
The Home Valuation Report is an in-depth analysis detailing your home's value as well as a comparison with similar homes in the area
Home Values in the Area
Average Home Value in this Area
Purchase History
| Date | Buyer | Sale Price | Title Company |
|---|---|---|---|
| Chaurasia Avinash | -- | None Available | |
| Chaurasia Avinash | $440,000 | Chicago Title Company | |
| Herrera Michele M | -- | Placer Title Company | |
| Herrera Michele | -- | -- |
Source: Public Records
Mortgage History
| Date | Status | Borrower | Loan Amount |
|---|---|---|---|
| Open | Chaurasia Avinash | $352,000 | |
| Previous Owner | Herrera Michele M | $215,000 |
Source: Public Records
Tax History Compared to Growth
Tax History
| Year | Tax Paid | Tax Assessment Tax Assessment Total Assessment is a certain percentage of the fair market value that is determined by local assessors to be the total taxable value of land and additions on the property. | Land | Improvement |
|---|---|---|---|---|
| 2025 | $7,234 | $577,062 | $233,962 | $350,100 |
| 2024 | $7,234 | $565,609 | $229,375 | $343,234 |
| 2023 | $7,032 | $561,383 | $224,878 | $336,505 |
| 2022 | $6,930 | $543,380 | $220,470 | $329,910 |
| 2021 | $6,762 | $532,588 | $216,147 | $323,441 |
| 2020 | $6,748 | $534,060 | $213,932 | $320,128 |
| 2019 | $6,672 | $523,590 | $209,739 | $313,851 |
| 2018 | $2,938 | $205,627 | $205,627 | $0 |
| 2017 | $6,446 | $509,293 | $201,595 | $307,698 |
| 2016 | $6,331 | $499,309 | $197,643 | $301,666 |
| 2015 | $6,241 | $491,811 | $194,675 | $297,136 |
| 2014 | $6,130 | $537,428 | $161,228 | $376,200 |
Source: Public Records
Map
Nearby Homes
- 4860 Bryce Canyon Park Dr
- 5341 Audubon Park Ct
- 4537 Capewood Terrace
- 4533 Capewood Terrace
- 4751 Wadsworth Ct
- 40696 Robin St
- 42932 Peachwood St
- 43163 Grimmer Terrace
- 4309 Bora Ave
- 40422 Landon Ave
- 41882 Gifford St
- 4840 Piper St
- 48 Eagle Green
- 92 Delta Green
- 4463 Hyde Common Unit 306
- 3923 Wildflower Common Unit 19
- 3872 Wildflower Common Unit 27
- 4214 Providence Terrace
- 4421 Cahill St
- 5560 Boscell Common
- 4897 Valpey Park Ave
- 4873 Valpey Park Ave
- 4884 Bryce Canyon Park Dr
- 4872 Bryce Canyon Park Dr
- 4925 Valpey Park Ave
- 4861 Valpey Park Ave
- 4896 Bryce Canyon Park Dr
- 42502 Isle Royal St
- 4949 Valpey Park Ave
- 4928 Bryce Canyon Park Dr
- 4849 Valpey Park Ave
- 4920 Valpey Park Ave
- 42501 Saratoga Park St
- 4848 Bryce Canyon Park Dr
- 42514 Isle Royal St
- 4944 Valpey Park Ave
- 42513 Saratoga Park St
- 4837 Valpey Park Ave
- 42458 Greenbrier Park Dr
- 4881 Bryce Canyon Park Dr Unit D