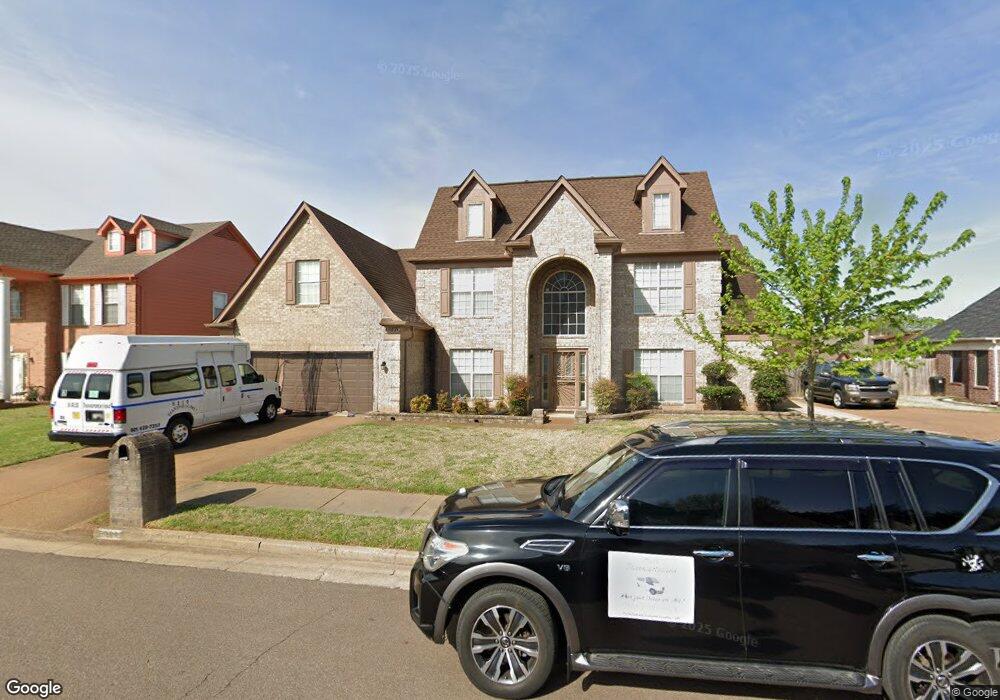
4887 Lanlee Dr Memphis, TN 38125
Southern Shelby County NeighborhoodEstimated Value: $330,188 - $387,000
4
Beds
3
Baths
2,861
Sq Ft
$122/Sq Ft
Est. Value
About This Home
This home is located at 4887 Lanlee Dr, Memphis, TN 38125 and is currently estimated at $348,797, approximately $121 per square foot. 4887 Lanlee Dr is a home located in Shelby County with nearby schools including Highland Oaks Elementary School, Highland Oaks Middle School, and Southwind High School.
Ownership History
Date
Name
Owned For
Owner Type
Purchase Details
Closed on
Oct 19, 2006
Sold by
Mortgage Electronic Registration Systems
Bought by
Foster Sandra
Current Estimated Value
Home Financials for this Owner
Home Financials are based on the most recent Mortgage that was taken out on this home.
Original Mortgage
$165,600
Outstanding Balance
$109,307
Interest Rate
8.47%
Mortgage Type
Purchase Money Mortgage
Estimated Equity
$239,490
Purchase Details
Closed on
Nov 13, 2005
Sold by
Tenort Bobbie J and Tenort Donald
Bought by
Mortgage Electronic Registration Systems and Gmac Mortgage
Purchase Details
Closed on
Apr 30, 2003
Sold by
Bowden Building Corp
Bought by
Tenort Bobbie J
Home Financials for this Owner
Home Financials are based on the most recent Mortgage that was taken out on this home.
Original Mortgage
$204,250
Interest Rate
5.86%
Mortgage Type
Purchase Money Mortgage
Create a Home Valuation Report for This Property
The Home Valuation Report is an in-depth analysis detailing your home's value as well as a comparison with similar homes in the area
Home Values in the Area
Average Home Value in this Area
Purchase History
| Date | Buyer | Sale Price | Title Company |
|---|---|---|---|
| Foster Sandra | $207,000 | Associates Closing & Title H | |
| Mortgage Electronic Registration Systems | $199,800 | -- | |
| Tenort Bobbie J | $215,000 | Memphis Title Company |
Source: Public Records
Mortgage History
| Date | Status | Borrower | Loan Amount |
|---|---|---|---|
| Open | Foster Sandra | $165,600 | |
| Previous Owner | Tenort Bobbie J | $204,250 |
Source: Public Records
Tax History Compared to Growth
Tax History
| Year | Tax Paid | Tax Assessment Tax Assessment Total Assessment is a certain percentage of the fair market value that is determined by local assessors to be the total taxable value of land and additions on the property. | Land | Improvement |
|---|---|---|---|---|
| 2025 | $2,350 | $86,050 | $14,875 | $71,175 |
| 2024 | $2,350 | $69,325 | $8,750 | $60,575 |
| 2023 | $2,350 | $69,325 | $8,750 | $60,575 |
| 2022 | $2,350 | $69,325 | $8,750 | $60,575 |
| 2021 | $2,392 | $69,325 | $8,750 | $60,575 |
| 2020 | $1,648 | $40,700 | $8,750 | $31,950 |
| 2019 | $1,648 | $40,700 | $8,750 | $31,950 |
| 2018 | $1,648 | $40,700 | $8,750 | $31,950 |
| 2017 | $1,673 | $40,700 | $8,750 | $31,950 |
| 2016 | $1,559 | $35,675 | $0 | $0 |
| 2014 | $1,559 | $35,675 | $0 | $0 |
Source: Public Records
Map
Nearby Homes
- 4768 Bradfield Run
- 4735 Harvest Knoll Cove N
- 7524 Bronze Dr
- 7518 Harvest Park Cove
- 7164 Germantown Trails Rd
- 5100 Sunny Autumn Ln
- 7125 Farmhouse Dr
- 7395 Old Dominion Ct
- 7473 Kylan Dr
- 7120 Gleneagles Dr
- 4826 Callaway Hills Dr
- 7321 Stonington Dr
- 5094 Denton Cove N
- 5178 Autumn Morning Cove
- 7112 Kings Grant Cove
- 7685 Shadowcrest Rd
- 5275 Annandale Dr
- 5050 Granite Creek Rd
- 5286 Autumn Forrest Dr
- 7555 Windsong Dr
- 4881 Lanlee Dr
- 4893 Lanlee Dr
- 7320 Foyle Cove E
- 7314 Foyle Cove E
- 4886 Lanlee Dr
- 4897 Lanlee Dr
- 4890 Lanlee Dr
- 7315 Foyle Cove E
- 4878 Lanlee Dr
- 7335 Nicholas Ln
- 4894 Lanlee Dr
- 7325 Nicholas Ln
- 4874 Lanlee Dr
- 4905 Lanlee Dr
- 7310 Foyle Cove E
- 7317 Nicholas Ln
- 7314 Rourke Cove
- 7309 Foyle Cove E
- 4904 Lanlee Dr
- 4875 Harvest Knoll Ln