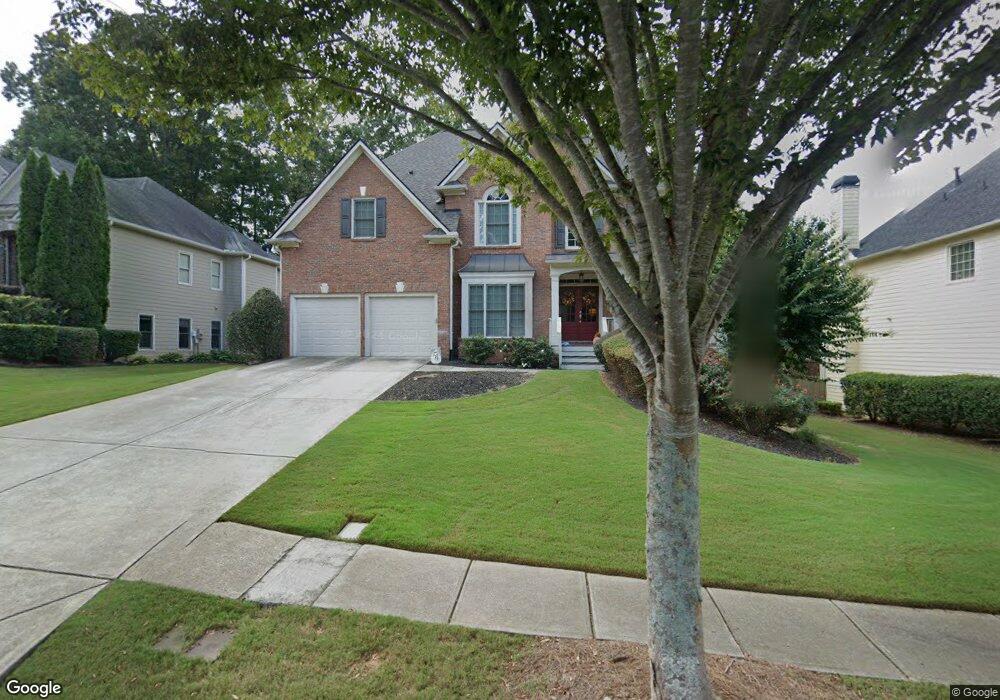
4887 Shellnut Path Hoschton, GA 30548
Estimated Value: $545,775 - $596,000
5
Beds
3
Baths
3,009
Sq Ft
$192/Sq Ft
Est. Value
About This Home
This home is located at 4887 Shellnut Path, Hoschton, GA 30548 and is currently estimated at $576,944, approximately $191 per square foot. 4887 Shellnut Path is a home located in Gwinnett County with nearby schools including Duncan Creek Elementary School, Frank N. Osborne Middle School, and Mill Creek High School.
Ownership History
Date
Name
Owned For
Owner Type
Purchase Details
Closed on
May 14, 2009
Sold by
Brookshire Joshua S
Bought by
Brookshire Joshua S and Brookshire Leandra J
Current Estimated Value
Home Financials for this Owner
Home Financials are based on the most recent Mortgage that was taken out on this home.
Original Mortgage
$282,500
Outstanding Balance
$177,720
Interest Rate
4.77%
Mortgage Type
Stand Alone Second
Estimated Equity
$399,224
Purchase Details
Closed on
Mar 26, 2007
Sold by
Peterson Jason A and Peterson Karna D
Bought by
Brookshire Joshua S
Home Financials for this Owner
Home Financials are based on the most recent Mortgage that was taken out on this home.
Original Mortgage
$278,400
Interest Rate
6.22%
Mortgage Type
New Conventional
Purchase Details
Closed on
Nov 7, 2005
Sold by
Wh Builders
Bought by
Peterson Jason A and Peterson Karna
Home Financials for this Owner
Home Financials are based on the most recent Mortgage that was taken out on this home.
Original Mortgage
$26,600
Interest Rate
5.48%
Mortgage Type
New Conventional
Create a Home Valuation Report for This Property
The Home Valuation Report is an in-depth analysis detailing your home's value as well as a comparison with similar homes in the area
Home Values in the Area
Average Home Value in this Area
Purchase History
| Date | Buyer | Sale Price | Title Company |
|---|---|---|---|
| Brookshire Joshua S | -- | -- | |
| Brookshire Joshua S | $348,000 | -- | |
| Peterson Jason A | $333,000 | -- |
Source: Public Records
Mortgage History
| Date | Status | Borrower | Loan Amount |
|---|---|---|---|
| Open | Brookshire Joshua S | $282,500 | |
| Previous Owner | Brookshire Joshua S | $278,400 | |
| Previous Owner | Peterson Jason A | $26,600 | |
| Previous Owner | Peterson Jason A | $266,400 |
Source: Public Records
Tax History Compared to Growth
Tax History
| Year | Tax Paid | Tax Assessment Tax Assessment Total Assessment is a certain percentage of the fair market value that is determined by local assessors to be the total taxable value of land and additions on the property. | Land | Improvement |
|---|---|---|---|---|
| 2024 | $6,099 | $206,800 | $45,600 | $161,200 |
| 2023 | $6,099 | $213,520 | $45,600 | $167,920 |
| 2022 | $5,641 | $186,080 | $40,400 | $145,680 |
| 2021 | $4,816 | $143,080 | $29,600 | $113,480 |
| 2020 | $4,849 | $143,080 | $29,600 | $113,480 |
| 2019 | $4,491 | $133,360 | $29,600 | $103,760 |
| 2018 | $4,499 | $133,360 | $29,600 | $103,760 |
| 2016 | $4,393 | $127,520 | $25,200 | $102,320 |
| 2015 | $4,272 | $119,920 | $25,200 | $94,720 |
| 2014 | -- | $101,160 | $19,200 | $81,960 |
Source: Public Records
Map
Nearby Homes
- 4881 Bill Cheek Rd
- 1547 Trilogy Park Dr
- 1351 Ashbury Park Dr NE
- 1535 Moriah Trace
- 4850 Boulder Stone Way
- 1331 Ashbury Park Dr
- 1351 Ashbury Park Way E
- 5599 Wheeler Ridge Rd
- 4452 Orchard Grove Dr
- 4362 Orchard Grove Dr
- 5171 Woodline
- 5689 Wheeler Ridge Rd
- 2030 Havenhurst Way
- 5130 Woodline View Cir
- 1491 Torrington Dr
- 2134 Woodmarsh Cir
- 2088 Skybrooke Ct
- 2013 Skybrooke Ln
- 5747 Wheeler Rd
- 4897 Shellnut Path
- 4877 Shellnut Path
- 4806 Trilogy Park Trail
- 4806 Trilogy Park Trail Unit 7
- 4907 Shellnut Path
- 4816 Trilogy Park Trail
- 4867 Shellnut Path Unit 54
- 4867 Shellnut Path
- 4806 Trilogy Park Trail NE
- 4860 Shellnut Pth NE
- 4796 Trilogy Park Trail
- 4880 Shellnut Path
- 4890 Shellnut Path Unit 4
- 0 Shellnut Pth NE Unit 8693182
- 0 Shellnut Pth NE Unit 7021069
- 0 Shellnut Pth NE Unit 7245956
- 0 Shellnut Pth NE
- 4860 Shellnut Path
- 4826 Trilogy Park Trail
- 5162 Shellnut