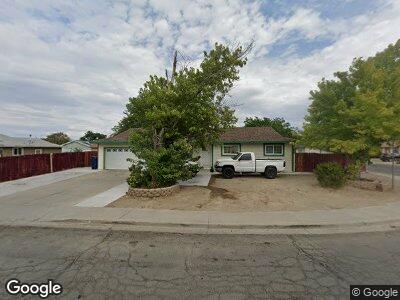
489 6th St Fernley, NV 89408
Estimated Value: $328,000 - $341,000
3
Beds
2
Baths
1,426
Sq Ft
$234/Sq Ft
Est. Value
About This Home
This home is located at 489 6th St, Fernley, NV 89408 and is currently estimated at $333,667, approximately $233 per square foot. 489 6th St is a home located in Lyon County with nearby schools including Fernley Elementary School, Fernley Intermediate School, and Fernley High School.
Ownership History
Date
Name
Owned For
Owner Type
Purchase Details
Closed on
Dec 8, 2011
Sold by
Federal National Mortgage Association
Bought by
Dearriaga M Carmen Martinez
Current Estimated Value
Purchase Details
Closed on
Sep 14, 2010
Sold by
Latorre Nicholas J and Latorre Cindy M
Bought by
Federal National Mortgage Association
Create a Home Valuation Report for This Property
The Home Valuation Report is an in-depth analysis detailing your home's value as well as a comparison with similar homes in the area
Home Values in the Area
Average Home Value in this Area
Purchase History
| Date | Buyer | Sale Price | Title Company |
|---|---|---|---|
| Dearriaga M Carmen Martinez | $45,000 | Servicelink | |
| Federal National Mortgage Association | $158,146 | Servicelink |
Source: Public Records
Mortgage History
| Date | Status | Borrower | Loan Amount |
|---|---|---|---|
| Previous Owner | Latorre Nicholas J | $50,000 | |
| Previous Owner | Latorre Nicholas J | $148,000 | |
| Previous Owner | Latorre Nicholas J | $27,750 |
Source: Public Records
Tax History Compared to Growth
Tax History
| Year | Tax Paid | Tax Assessment Tax Assessment Total Assessment is a certain percentage of the fair market value that is determined by local assessors to be the total taxable value of land and additions on the property. | Land | Improvement |
|---|---|---|---|---|
| 2024 | $1,340 | $84,297 | $61,250 | $23,046 |
| 2023 | $1,340 | $83,395 | $61,250 | $22,145 |
| 2022 | $1,270 | $82,345 | $61,250 | $21,095 |
| 2021 | $1,270 | $64,784 | $43,750 | $21,034 |
| 2020 | $1,240 | $64,178 | $43,750 | $20,428 |
| 2019 | $1,232 | $63,841 | $43,750 | $20,091 |
| 2018 | $1,212 | $51,480 | $31,500 | $19,980 |
| 2017 | $1,221 | $44,320 | $23,980 | $20,340 |
| 2016 | $1,045 | $27,992 | $6,300 | $21,692 |
| 2015 | $1,081 | $24,607 | $6,300 | $18,307 |
| 2014 | $1,061 | $19,742 | $6,300 | $13,442 |
Source: Public Records
Map
Nearby Homes