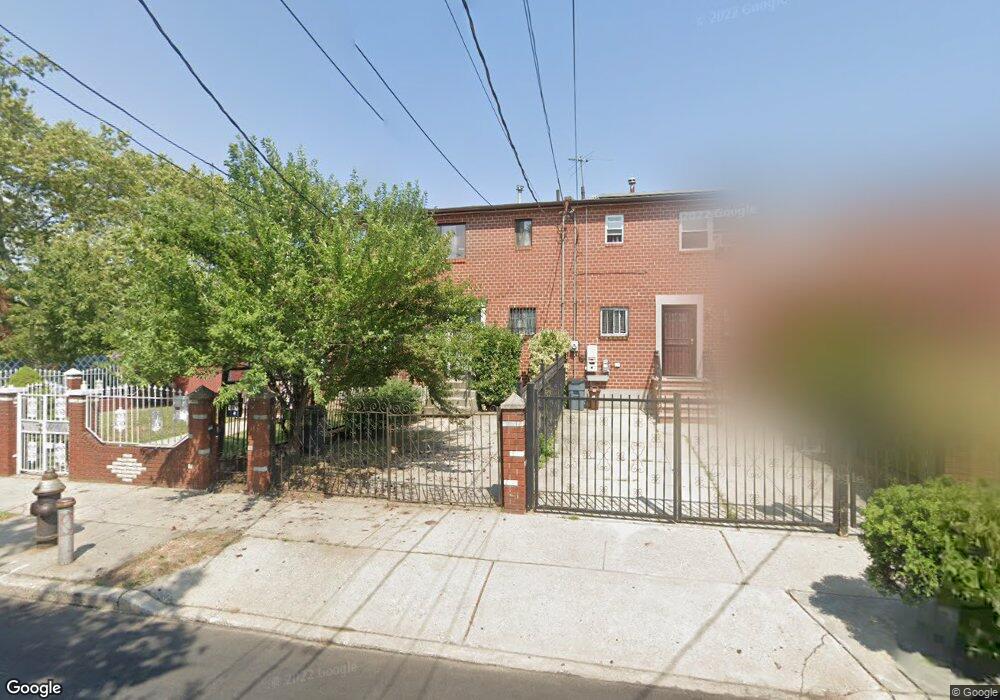
489 Christopher Ave Unit Building Brooklyn, NY 11212
Brownsville NeighborhoodEstimated Value: $572,000 - $752,000
--
Bed
2
Baths
1,128
Sq Ft
$575/Sq Ft
Est. Value
About This Home
This home is located at 489 Christopher Ave Unit Building, Brooklyn, NY 11212 and is currently estimated at $648,436, approximately $574 per square foot. 489 Christopher Ave Unit Building is a home located in Kings County with nearby schools including P.S. 165 Ida Posner, P.S. 150 - Christopher, and P.S. 156 Waverly.
Ownership History
Date
Name
Owned For
Owner Type
Purchase Details
Closed on
Jan 16, 2024
Sold by
Christopher 489 2 Llc
Bought by
Martinez Alba and Rosario Oliver
Current Estimated Value
Home Financials for this Owner
Home Financials are based on the most recent Mortgage that was taken out on this home.
Original Mortgage
$569,999
Outstanding Balance
$560,024
Interest Rate
6.95%
Mortgage Type
Purchase Money Mortgage
Estimated Equity
$88,412
Purchase Details
Closed on
Dec 13, 2022
Sold by
Bank Of America Na
Bought by
Christopher 489 2 Llc
Purchase Details
Closed on
Jun 13, 2019
Sold by
Blank Esq Helene
Bought by
Bank Of America N A
Purchase Details
Closed on
Jun 15, 1989
Sold by
Green Edward Lee
Bought by
Green Deloise and Green Edward Lee
Purchase Details
Closed on
Feb 9, 1989
Sold by
East Bklyn Chu
Bought by
Green Edward Lee
Create a Home Valuation Report for This Property
The Home Valuation Report is an in-depth analysis detailing your home's value as well as a comparison with similar homes in the area
Home Values in the Area
Average Home Value in this Area
Purchase History
| Date | Buyer | Sale Price | Title Company |
|---|---|---|---|
| Martinez Alba | $600,000 | -- | |
| Martinez Alba | $600,000 | -- | |
| Christopher 489 2 Llc | $364,661 | -- | |
| Christopher 489 2 Llc | $364,661 | -- | |
| Bank Of America N A | $410,000 | -- | |
| Bank Of America N A | $410,000 | -- | |
| Green Deloise | -- | -- | |
| Green Deloise | -- | -- | |
| Green Edward Lee | -- | -- | |
| Green Edward Lee | -- | -- |
Source: Public Records
Mortgage History
| Date | Status | Borrower | Loan Amount |
|---|---|---|---|
| Open | Martinez Alba | $569,999 | |
| Closed | Martinez Alba | $569,999 |
Source: Public Records
Tax History Compared to Growth
Tax History
| Year | Tax Paid | Tax Assessment Tax Assessment Total Assessment is a certain percentage of the fair market value that is determined by local assessors to be the total taxable value of land and additions on the property. | Land | Improvement |
|---|---|---|---|---|
| 2025 | $4,373 | $34,260 | $13,560 | $20,700 |
| 2024 | $4,373 | $32,520 | $13,560 | $18,960 |
| 2023 | $4,422 | $33,120 | $13,560 | $19,560 |
| 2022 | $4,314 | $34,440 | $13,560 | $20,880 |
| 2021 | $4,290 | $30,840 | $13,560 | $17,280 |
| 2020 | $3,218 | $25,140 | $13,560 | $11,580 |
| 2019 | $3,503 | $25,140 | $13,560 | $11,580 |
| 2018 | $3,401 | $18,144 | $11,486 | $6,658 |
| 2017 | $3,371 | $18,007 | $11,899 | $6,108 |
| 2016 | $3,086 | $16,988 | $12,629 | $4,359 |
| 2015 | $1,914 | $16,027 | $11,201 | $4,826 |
| 2014 | $1,914 | $15,120 | $11,280 | $3,840 |
Source: Public Records
Map
Nearby Homes
- 699 Sackman St
- 546 Powell St
- 797 Mother Gaston Blvd
- 563 Powell St
- 258 Lott Ave
- 555 Christopher Ave
- 578 Christopher Ave
- 587 Osborn St
- 533 Snediker Ave
- 442 Newport St
- 584 Hinsdale St
- 504 Thatford Ave
- 892 Mother Gaston Blvd
- 541 Hinsdale St
- 589 Hinsdale St
- 578 Williams Ave
- 576 Williams Ave
- 923 Rockaway Ave
- 582 Williams Ave
- 632 Osborn St
- 489 Christopher Ave
- 491 Christopher Ave
- 487 Christopher Ave
- 493 Christopher Ave
- 495 Christopher Ave
- 497 Christopher Ave
- 499 Christopher Ave
- 702 Sackman St
- 700 Sackman St
- 700 Sackman St Unit 2
- 706 Sackman St
- 483 Christopher Ave
- 708 Sackman St
- 501 Christopher Ave
- 712 Sackman St
- 310 Newport St
- 714 Sackman St
- 503 Christopher Ave
- 481 Christopher Ave
- 718 Sackman St