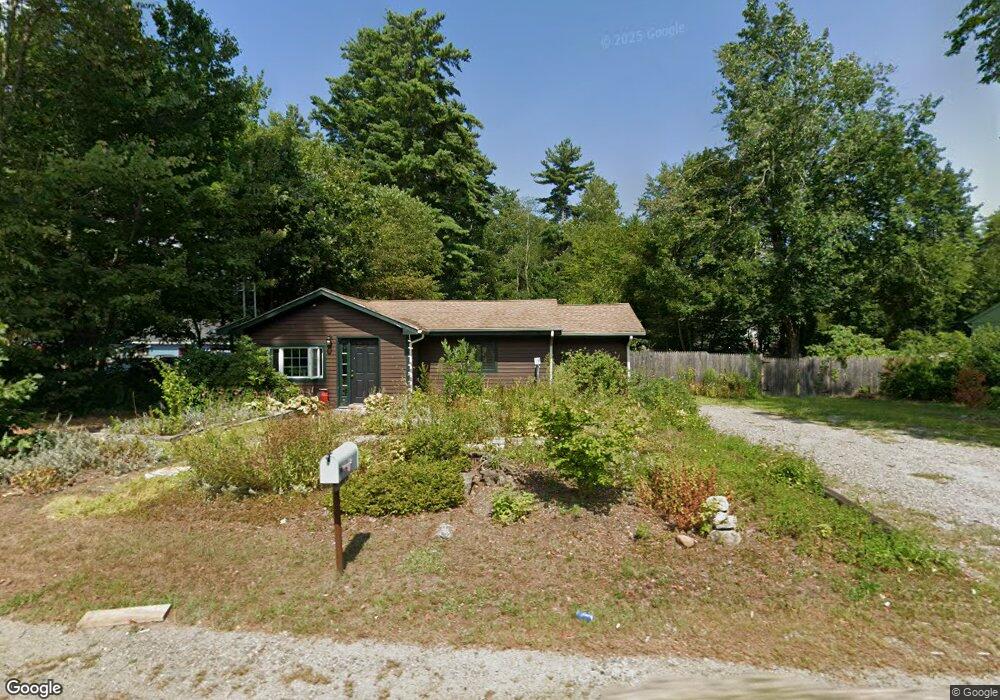
489 E River St Orange, MA 01364
Estimated Value: $216,000 - $265,000
2
Beds
1
Bath
756
Sq Ft
$322/Sq Ft
Est. Value
About This Home
This home is located at 489 E River St, Orange, MA 01364 and is currently estimated at $243,529, approximately $322 per square foot. 489 E River St is a home located in Franklin County with nearby schools including Fisher Hill and Ralph C Mahar Regional School.
Ownership History
Date
Name
Owned For
Owner Type
Purchase Details
Closed on
Dec 28, 2010
Sold by
Fhlmc
Bought by
Henning Art J and Goordial Chitra T
Current Estimated Value
Purchase Details
Closed on
Dec 14, 2010
Sold by
Sawin Elaine P and Central Mortgage Co
Bought by
Fhlmc
Purchase Details
Closed on
Sep 5, 2003
Sold by
Sawin Elaine and Knowles Keith
Bought by
Sawin Elaine P
Home Financials for this Owner
Home Financials are based on the most recent Mortgage that was taken out on this home.
Original Mortgage
$45,000
Interest Rate
6.02%
Mortgage Type
Purchase Money Mortgage
Purchase Details
Closed on
Jun 9, 2003
Sold by
Mallett Ernest L and Mallett Lavera I
Bought by
Sawin Elaine and Knowles Keith
Purchase Details
Closed on
Sep 27, 1988
Sold by
Duel Harry
Bought by
Mallett Ernest L
Create a Home Valuation Report for This Property
The Home Valuation Report is an in-depth analysis detailing your home's value as well as a comparison with similar homes in the area
Home Values in the Area
Average Home Value in this Area
Purchase History
| Date | Buyer | Sale Price | Title Company |
|---|---|---|---|
| Henning Art J | $15,000 | -- | |
| Fhlmc | $35,000 | -- | |
| Sawin Elaine P | -- | -- | |
| Sawin Elaine | $8,000 | -- | |
| Mallett Ernest L | $40,000 | -- |
Source: Public Records
Mortgage History
| Date | Status | Borrower | Loan Amount |
|---|---|---|---|
| Previous Owner | Mallett Ernest L | $45,000 |
Source: Public Records
Tax History
| Year | Tax Paid | Tax Assessment Tax Assessment Total Assessment is a certain percentage of the fair market value that is determined by local assessors to be the total taxable value of land and additions on the property. | Land | Improvement |
|---|---|---|---|---|
| 2025 | $23 | $138,600 | $28,000 | $110,600 |
| 2024 | $2,252 | $129,100 | $28,000 | $101,100 |
| 2023 | $2,164 | $120,500 | $28,000 | $92,500 |
| 2022 | $1,644 | $86,000 | $28,000 | $58,000 |
| 2021 | $1,716 | $85,600 | $45,900 | $39,700 |
| 2020 | $1,704 | $83,800 | $45,500 | $38,300 |
| 2019 | $1,651 | $73,300 | $39,600 | $33,700 |
| 2018 | $1,529 | $69,700 | $36,900 | $32,800 |
| 2017 | $1,516 | $71,400 | $36,900 | $34,500 |
| 2016 | $1,391 | $64,100 | $36,900 | $27,200 |
| 2015 | $1,288 | $62,000 | $36,900 | $25,100 |
| 2014 | $1,224 | $62,000 | $36,900 | $25,100 |
Source: Public Records
Map
Nearby Homes
- 481 E River St
- 509 E River St
- 500 E River St
- 475 E River St
- 482 E River St
- 511 E River St
- 474 E River St
- 471 E River St
- 56 Robin Ln
- 0 E River St
- 00 E River St
- 513 E River St
- 11 Shingle Brook Rd
- 465 E River St
- 513 E River St
- 4 Shingle Brook Rd
- 468 E River St
- 15 Shingle Brook Rd
- 6 Shingle Brook Rd
- 6 Shingle Brook Rd
Your Personal Tour Guide
Ask me questions while you tour the home.