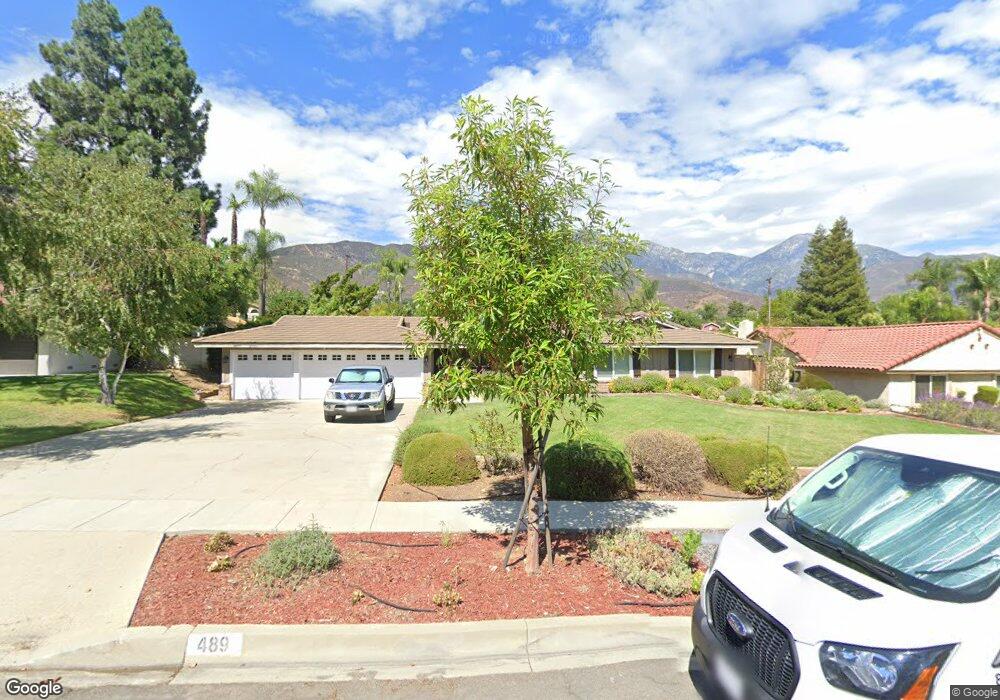
489 Emerson St Upland, CA 91784
Upland AreaEstimated Value: $1,142,821 - $1,189,000
About This Home
This home is located at 489 Emerson St, Upland, CA 91784 and is currently estimated at $1,171,205, approximately $482 per square foot. 489 Emerson St is a home located in San Bernardino County with nearby schools including Valencia Elementary, Pioneer Junior High School, and Upland High School.
Ownership History
We collect this data history from publicly available records. To have your information removed, we recommend requesting removal directly through your county’s website.
Purchase Details
Purchase Details
Home Values in the Area
Average Home Value in this Area
Purchase History
We collect this data history from publicly available records. To have your information removed, we recommend requesting removal directly through your county’s website.
| Date | Buyer | Sale Price | Title Company |
|---|---|---|---|
| -- | None Available | ||
| $245,000 | First American Title Ins Co |
Mortgage History
We collect this data history from publicly available records. To have your information removed, we recommend requesting removal directly through your county’s website.
| Date | Status | Borrower | Loan Amount |
|---|---|---|---|
| Closed | $224,000 | ||
| Closed | $56,000 | ||
| Closed | $50,000 | ||
| Closed | $190,650 | ||
| Closed | $15,000 |
Tax History
We collect this data history from publicly available records. To have your information removed, we recommend requesting removal directly through your county’s website.
| Year | Tax Paid | Tax Assessment Tax Assessment Total Assessment is a certain percentage of the fair market value that is determined by local assessors to be the total taxable value of land and additions on the property. | Land | Improvement |
|---|---|---|---|---|
| 2026 | $4,547 | $419,750 | $145,627 | $274,123 |
| 2025 | $4,547 | $411,520 | $142,772 | $268,748 |
| 2024 | $4,402 | $403,451 | $139,973 | $263,478 |
| 2023 | $4,334 | $395,540 | $137,228 | $258,312 |
| 2022 | $4,313 | $387,784 | $134,537 | $253,247 |
| 2021 | $4,231 | $380,180 | $131,899 | $248,281 |
| 2020 | $4,116 | $376,282 | $130,547 | $245,735 |
| 2019 | $4,101 | $368,904 | $127,987 | $240,917 |
| 2018 | $4,000 | $361,670 | $125,477 | $236,193 |
| 2017 | $3,884 | $354,579 | $123,017 | $231,562 |
| 2016 | $3,678 | $347,627 | $120,605 | $227,022 |
| 2015 | $3,593 | $342,405 | $118,793 | $223,612 |
| 2014 | $3,499 | $335,698 | $116,466 | $219,232 |
Map
- 2316 N Orange Dr W
- 680 W Byron Ct
- 2304 N San Antonio Ave
- 959 -959B Kenwood St
- 2335 N San Antonio Ave
- 2215 N Euclid Ave
- 200 W 24th St
- 895 W 23rd St
- 2415 Sierra Dr
- 388 Revere St
- 910 W 21st St
- 2499 Sierra Dr
- 2351 Sunfield Way
- 2480 Vista Dr
- 2056 Coolcrest Ave
- 425 E 24th St
- 1140 W 22nd St
- 701 Kilbourne Dr
- 2446 Euclid Crescent E
- 2510 Belleview Rd
Ask me questions while you tour the home.