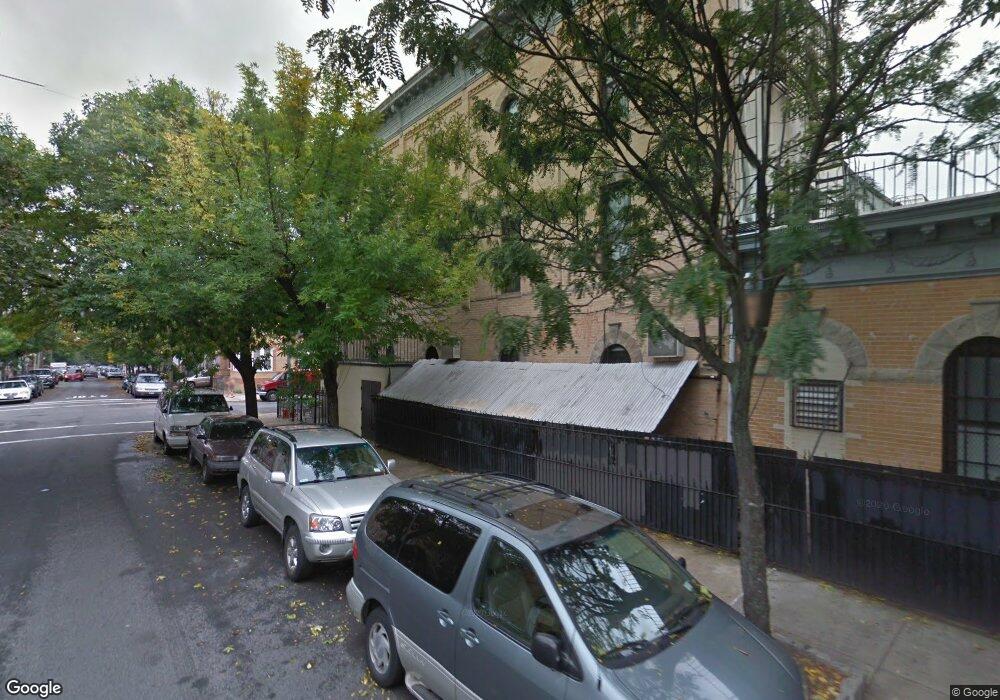
489 Fairview Ave Flushing, NY 11385
Ridgewood NeighborhoodEstimated Value: $1,664,250
Studio
--
Bath
5,675
Sq Ft
$293/Sq Ft
Est. Value
About This Home
This home is located at 489 Fairview Ave, Flushing, NY 11385 and is currently estimated at $1,664,250, approximately $293 per square foot. 489 Fairview Ave is a home located in Queens County with nearby schools including P.S. 71 Forest, I.S. 093 Ridgewood, and Grover Cleveland High School.
Ownership History
Date
Name
Owned For
Owner Type
Purchase Details
Closed on
May 18, 2009
Sold by
Mmr 489 Llc
Bought by
Artvelin 489 Llc
Current Estimated Value
Home Financials for this Owner
Home Financials are based on the most recent Mortgage that was taken out on this home.
Original Mortgage
$667,500
Outstanding Balance
$419,241
Interest Rate
4.82%
Mortgage Type
Commercial
Estimated Equity
$1,245,009
Purchase Details
Closed on
Jun 17, 2004
Sold by
Emil Romotzki Llc
Bought by
Mbr And Mmr 489 Llc and Romotzki
Purchase Details
Closed on
Feb 25, 2003
Sold by
Tapalaga Persa
Bought by
Romotzki Emil
Purchase Details
Closed on
Nov 3, 1999
Sold by
Zivkovic Rozika
Bought by
Tapalaga Persa
Home Financials for this Owner
Home Financials are based on the most recent Mortgage that was taken out on this home.
Original Mortgage
$200,000
Interest Rate
7.9%
Mortgage Type
Commercial
Purchase Details
Closed on
Apr 18, 1994
Sold by
Zivkovic Rozika and Zivkovic Alexander
Bought by
Zivkovic Rozika
Create a Home Valuation Report for This Property
The Home Valuation Report is an in-depth analysis detailing your home's value as well as a comparison with similar homes in the area
Home Values in the Area
Average Home Value in this Area
Purchase History
| Date | Buyer | Sale Price | Title Company |
|---|---|---|---|
| Artvelin 489 Llc | $890,000 | -- | |
| Artvelin 489 Llc | $890,000 | -- | |
| Mbr And Mmr 489 Llc | -- | -- | |
| Mbr And Mmr 489 Llc | -- | -- | |
| Romotzki Emil | $420,000 | -- | |
| Romotzki Emil | $420,000 | -- | |
| Tapalaga Persa | $287,000 | L I Title | |
| Tapalaga Persa | $287,000 | L I Title | |
| Zivkovic Rozika | -- | -- | |
| Zivkovic Rozika | -- | -- |
Source: Public Records
Mortgage History
| Date | Status | Borrower | Loan Amount |
|---|---|---|---|
| Open | Artvelin 489 Llc | $667,500 | |
| Closed | Artvelin 489 Llc | $667,500 | |
| Previous Owner | Tapalaga Persa | $200,000 | |
| Closed | Romotzki Emil | $0 |
Source: Public Records
Tax History
| Year | Tax Paid | Tax Assessment Tax Assessment Total Assessment is a certain percentage of the fair market value that is determined by local assessors to be the total taxable value of land and additions on the property. | Land | Improvement |
|---|---|---|---|---|
| 2025 | $26,163 | $210,783 | $72,200 | $138,583 |
| 2024 | $26,163 | $209,273 | $82,305 | $126,968 |
| 2023 | $24,273 | $194,150 | $70,027 | $124,123 |
| 2022 | $22,042 | $473,400 | $189,900 | $283,500 |
| 2021 | $21,438 | $421,650 | $189,900 | $231,750 |
| 2020 | $20,224 | $463,500 | $189,900 | $273,600 |
| 2019 | $20,303 | $393,660 | $189,900 | $203,760 |
| 2018 | $18,995 | $149,346 | $86,453 | $62,893 |
| 2017 | $17,626 | $138,581 | $84,633 | $53,948 |
| 2016 | $17,331 | $138,581 | $84,633 | $53,948 |
| 2015 | $10,740 | $124,724 | $95,524 | $29,200 |
| 2014 | $10,740 | $123,830 | $110,947 | $12,883 |
Source: Public Records
Map
Nearby Homes
- 1930 Bleecker St
- 1916 Himrod St
- 2027 Bleecker St
- 19-16 Himrod St
- 2015 Himrod St
- 2132 Bleecker St Unit 2
- 2132 Bleecker St Unit 1
- 508 Onderdonk Ave
- 1823 Bleecker St
- 566 Onderdonk Ave
- 2120 Grove St
- 655 Woodward Ave
- 63-16 Forest Ave Unit 1B
- 1811 Menahan St Unit 1
- 1811 Menahan St Unit 2R
- 1811 Menahan St Unit 2F
- 1811 Menahan St Unit 4
- 686 Fairview Ave
- 2031 Palmetto St
- 21-17 Rene Ct
- 487 Fairview Ave
- 20-19 Greene Ave
- 485 Fairview Ave
- 20-23 Greene Ave
- 2011 Greene Ave
- 483 Fairview Ave
- 2013 Greene Ave
- 501 Fairview Ave
- 2015 Greene Ave
- 481 Fairview Ave Unit 2F
- 481 Fairview Ave Unit 3R
- 481 Fairview Ave Unit 2R
- 481 Fairview Ave Unit 3B
- 481 Fairview Ave Unit 3F
- 481 Fairview Ave
- 481 Fairview Ave Unit 1L
- 503 Fairview Ave
- 2017 Greene Ave
- 20-17 Greene Ave
- 479 Fairview Ave
Your Personal Tour Guide
Ask me questions while you tour the home.