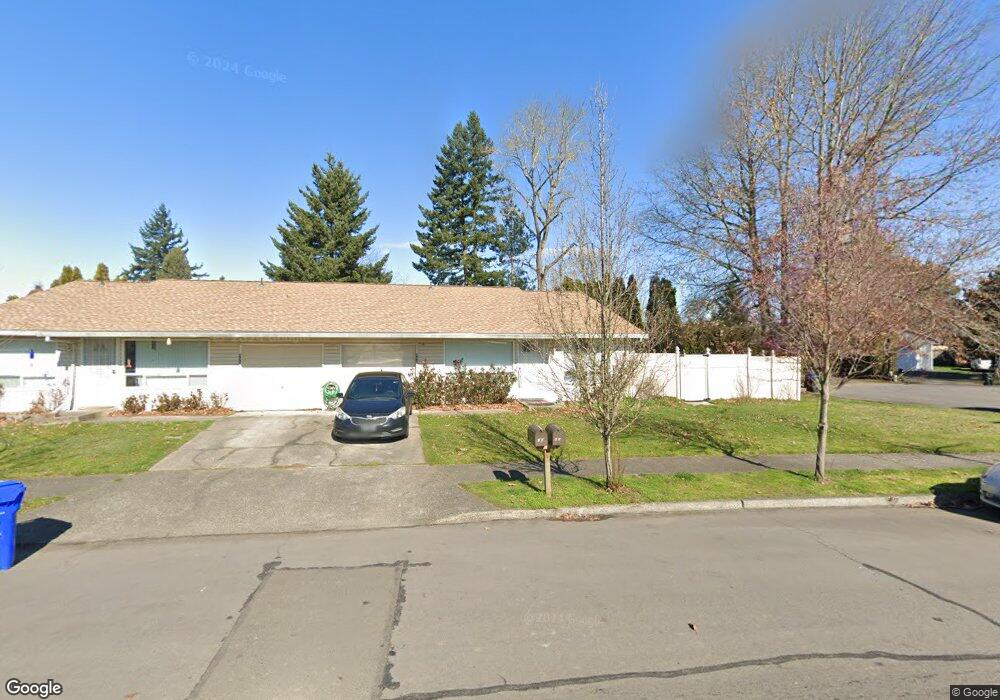
489 NE 18th St Gresham, OR 97030
North Central NeighborhoodEstimated Value: $395,000 - $404,000
3
Beds
2
Baths
1,040
Sq Ft
$384/Sq Ft
Est. Value
About This Home
This home is located at 489 NE 18th St, Gresham, OR 97030 and is currently estimated at $399,382, approximately $384 per square foot. 489 NE 18th St is a home located in Multnomah County with nearby schools including Highland Elementary School, Clear Creek Middle School, and Gresham High School.
Ownership History
Date
Name
Owned For
Owner Type
Purchase Details
Closed on
May 5, 2006
Sold by
Ziemianski Dennis J
Bought by
Ziemianski Dennis J and Ziemianski Kathleen J
Current Estimated Value
Home Financials for this Owner
Home Financials are based on the most recent Mortgage that was taken out on this home.
Original Mortgage
$152,000
Outstanding Balance
$87,046
Interest Rate
6.3%
Mortgage Type
Fannie Mae Freddie Mac
Estimated Equity
$312,336
Purchase Details
Closed on
Oct 27, 2003
Sold by
Cleveland Cleo Dee
Bought by
Ziemianski Dennis J
Home Financials for this Owner
Home Financials are based on the most recent Mortgage that was taken out on this home.
Original Mortgage
$140,790
Interest Rate
5.98%
Mortgage Type
FHA
Purchase Details
Closed on
Aug 17, 1995
Sold by
Haberman Kevin C
Bought by
Cleveland Cleo Dee
Home Financials for this Owner
Home Financials are based on the most recent Mortgage that was taken out on this home.
Original Mortgage
$94,500
Interest Rate
7.71%
Mortgage Type
Purchase Money Mortgage
Create a Home Valuation Report for This Property
The Home Valuation Report is an in-depth analysis detailing your home's value as well as a comparison with similar homes in the area
Home Values in the Area
Average Home Value in this Area
Purchase History
| Date | Buyer | Sale Price | Title Company |
|---|---|---|---|
| Ziemianski Dennis J | -- | Chicago Title Insurance Co | |
| Ziemianski Dennis J | $143,000 | Pacific Nw Title | |
| Cleveland Cleo Dee | $105,000 | Ticor Title Insurance |
Source: Public Records
Mortgage History
| Date | Status | Borrower | Loan Amount |
|---|---|---|---|
| Open | Ziemianski Dennis J | $152,000 | |
| Closed | Ziemianski Dennis J | $140,790 | |
| Previous Owner | Cleveland Cleo Dee | $94,500 |
Source: Public Records
Tax History
| Year | Tax Paid | Tax Assessment Tax Assessment Total Assessment is a certain percentage of the fair market value that is determined by local assessors to be the total taxable value of land and additions on the property. | Land | Improvement |
|---|---|---|---|---|
| 2025 | $3,974 | $195,300 | -- | -- |
| 2024 | $3,805 | $189,620 | -- | -- |
| 2023 | $3,466 | $184,100 | $0 | $0 |
| 2022 | $3,369 | $178,740 | $0 | $0 |
| 2021 | $3,284 | $173,540 | $0 | $0 |
| 2020 | $3,090 | $168,490 | $0 | $0 |
| 2019 | $3,010 | $163,590 | $0 | $0 |
| 2018 | $2,870 | $158,830 | $0 | $0 |
| 2017 | $2,753 | $154,210 | $0 | $0 |
| 2016 | $2,428 | $149,720 | $0 | $0 |
Source: Public Records
Map
Nearby Homes
- 1783 1791 NE Beech Place
- 349 NE 18th St
- 450 NE 22nd St
- 2105 NE Cleveland Ave
- 54 NW 13th St
- 660 NE 9th St
- 894 NE Linden Ave
- 1035 SE 225th Ave
- 2730 NE Roberts Ave
- 2775 NE Linden Ave
- 1830 NE Hogan Dr Unit 83
- 1802 NE Hogan Dr Unit 97
- 1722 NE Hogan Dr Unit 103
- 491 NE Elliott Ave
- 1418 NE Hogan Dr
- 1508 NE Hogan Dr Unit 134
- 1795 NE 19th St
- 0 NE 5th St
- 1308 NE Hogan Dr Unit 166
- 1812 NE 19th St Unit 27
- 455 NE 18th St Unit 463
- 501 NE 18th St
- 510 NE 19th St
- 500 NE 19th St
- 1814 NE Beech Ave
- 530 NE 19th St
- 1890 NE Beech Ave
- 525 NE 18th St
- 549 NE 18th St Unit 557
- 580 NE 19th St
- 446 NE 18th St Unit 450
- 571 NE 18th St Unit 585
- 1811 NE Beech Ave
- 480 NE 18th St Unit 488
- 420 NE 18th St Unit 428
- 505 NE 19th St
- 495 NE 19th St
- 600 NE 19th St
- 525 NE 19th St
- 1809 NE Elliott Place Unit 1817
Your Personal Tour Guide
Ask me questions while you tour the home.