Estimated Value: $815,000 - $906,000
6
Beds
4
Baths
2,390
Sq Ft
$359/Sq Ft
Est. Value
About This Home
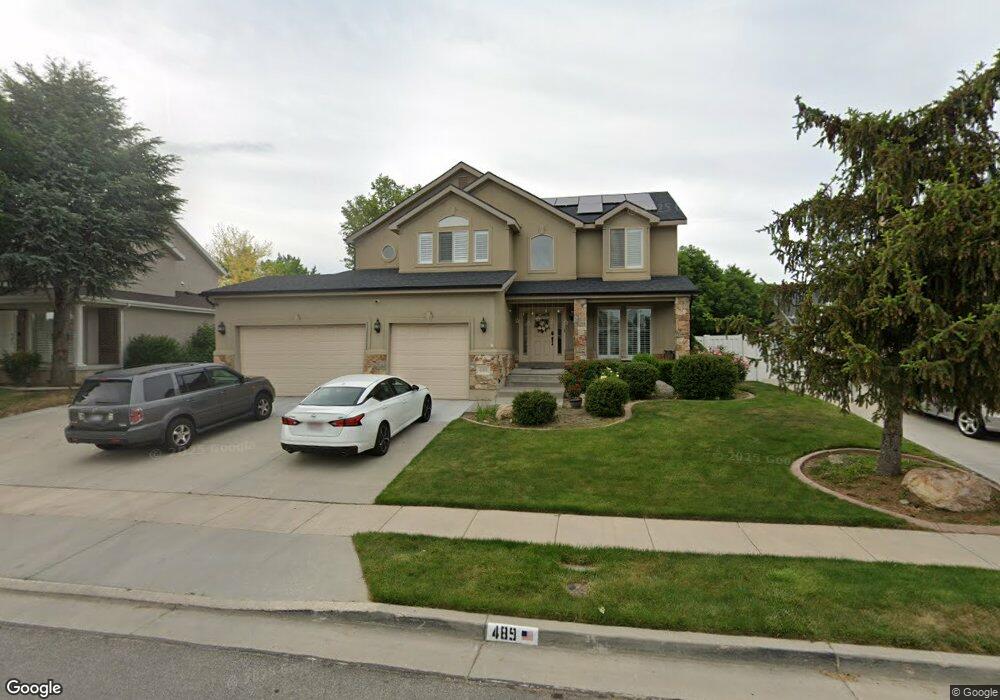
This home is located at 489 Sandy Oaks Dr, Sandy, UT 84070 and is currently estimated at $857,409, approximately $358 per square foot. 489 Sandy Oaks Dr is a home located in Salt Lake County with nearby schools including Sandy Elementary School, Mount Jordan Middle School, and Jordan High.
Ownership History
Date
Name
Owned For
Owner Type
Purchase Details
Closed on
Jun 14, 2018
Sold by
Rueckert Marc Alan
Bought by
Choudhari Dinesh
Current Estimated Value
Home Financials for this Owner
Home Financials are based on the most recent Mortgage that was taken out on this home.
Original Mortgage
$435,022
Outstanding Balance
$377,063
Interest Rate
4.6%
Mortgage Type
New Conventional
Estimated Equity
$480,346
Purchase Details
Closed on
Jun 12, 2018
Sold by
Choudhari Dinesh
Bought by
Choudhari Dinesh and Choudhari Vaishali
Home Financials for this Owner
Home Financials are based on the most recent Mortgage that was taken out on this home.
Original Mortgage
$435,022
Outstanding Balance
$377,063
Interest Rate
4.6%
Mortgage Type
New Conventional
Estimated Equity
$480,346
Purchase Details
Closed on
Jun 8, 2018
Sold by
Rueckert Stacey V
Bought by
Rueckert Marc Alan
Home Financials for this Owner
Home Financials are based on the most recent Mortgage that was taken out on this home.
Original Mortgage
$435,022
Outstanding Balance
$377,063
Interest Rate
4.6%
Mortgage Type
New Conventional
Estimated Equity
$480,346
Purchase Details
Closed on
Apr 28, 2016
Sold by
Rueckert Marc A and Rueckert Stacey V
Bought by
Rueckert Marc Alan
Home Financials for this Owner
Home Financials are based on the most recent Mortgage that was taken out on this home.
Original Mortgage
$297,500
Interest Rate
3.73%
Mortgage Type
New Conventional
Purchase Details
Closed on
Jan 22, 2008
Sold by
Rueckert Marc A
Bought by
Rueckert Marc A and Rueckert Stacey
Home Financials for this Owner
Home Financials are based on the most recent Mortgage that was taken out on this home.
Original Mortgage
$297,500
Interest Rate
5.64%
Mortgage Type
New Conventional
Purchase Details
Closed on
Oct 6, 2004
Sold by
Fisher Alex C and Fisher Anjalee A
Bought by
Rueckert Marc A
Home Financials for this Owner
Home Financials are based on the most recent Mortgage that was taken out on this home.
Original Mortgage
$262,800
Interest Rate
5.77%
Mortgage Type
Purchase Money Mortgage
Purchase Details
Closed on
Feb 6, 2003
Sold by
Fisher Alex C and Fisher Anjalee
Bought by
Fisher Alex C and Fisher Anjalee A
Home Financials for this Owner
Home Financials are based on the most recent Mortgage that was taken out on this home.
Original Mortgage
$246,800
Interest Rate
5.76%
Mortgage Type
Balloon
Purchase Details
Closed on
Jun 13, 2001
Sold by
New Mark Development Inc
Bought by
Fisher Alex C and Fisher Anjalee
Home Financials for this Owner
Home Financials are based on the most recent Mortgage that was taken out on this home.
Original Mortgage
$243,250
Interest Rate
7.14%
Create a Home Valuation Report for This Property
The Home Valuation Report is an in-depth analysis detailing your home's value as well as a comparison with similar homes in the area
Home Values in the Area
Average Home Value in this Area
Purchase History
| Date | Buyer | Sale Price | Title Company |
|---|---|---|---|
| Choudhari Dinesh | -- | Title Guarantee | |
| Choudhari Dinesh | -- | Us Title X | |
| Rueckert Marc Alan | -- | Title Guarantee | |
| Rueckert Marc Alan | -- | None Available | |
| Rueckert Marc A | -- | First American Title Ut Co | |
| Rueckert Marc A | -- | Integrated Title Ins Svcs | |
| Fisher Alex C | -- | Equity Title | |
| Fisher Alex C | -- | First American Title |
Source: Public Records
Mortgage History
| Date | Status | Borrower | Loan Amount |
|---|---|---|---|
| Open | Choudhari Dinesh | $435,022 | |
| Closed | Choudhari Dinesh | $437,750 | |
| Previous Owner | Rueckert Marc Alan | $297,500 | |
| Previous Owner | Rueckert Marc A | $297,500 | |
| Previous Owner | Rueckert Marc A | $262,800 | |
| Previous Owner | Fisher Alex C | $246,800 | |
| Previous Owner | Fisher Alex C | $243,250 |
Source: Public Records
Tax History
| Year | Tax Paid | Tax Assessment Tax Assessment Total Assessment is a certain percentage of the fair market value that is determined by local assessors to be the total taxable value of land and additions on the property. | Land | Improvement |
|---|---|---|---|---|
| 2025 | $4,022 | $745,500 | $173,600 | $571,900 |
| 2024 | $4,022 | $743,800 | $162,300 | $581,500 |
| 2023 | $3,738 | $689,300 | $154,300 | $535,000 |
| 2022 | $3,871 | $697,300 | $151,300 | $546,000 |
| 2021 | $3,604 | $552,700 | $129,300 | $423,400 |
| 2020 | $3,515 | $508,300 | $129,300 | $379,000 |
| 2019 | $3,582 | $504,700 | $122,000 | $382,700 |
| 2016 | $2,659 | $360,300 | $122,000 | $238,300 |
Source: Public Records
Map
Nearby Homes
- 8322 S Levine Ln Unit 111
- 359 E 8400 S
- 635 Pioneer Ave
- 8459 S 300 E
- 744 E 8425 S
- 227 E St Germain Way
- 627 E 8680 S
- 8390 S 745 E
- 220 E Pioneer Ave
- 194 Pioneer Ave
- 8732 S 620 E
- 8087 S 615 E
- 274 E Water Mill Way Unit 230
- 149 E Pioneer Ave
- 608 E 8800 S
- 144 E Chambord Ct
- 139 E Abbeville Ct
- 257 Water Mill Way Unit 211
- 140 E Chambord Ct
- 138 E Chambord Ct
- 489 E Sandy Oaks Dr
- 479 Sandy Oaks Dr
- 479 E Sandy Oaks Dr
- 501 E Sandy Oaks Dr
- 8424 S Sandy Oaks Dr
- 8424 Sandy Oaks Dr
- 488 E 8400 S
- 469 Sandy Oaks Dr
- 474 E 8400 S
- 490 E Sandy Oaks Dr
- 490 Sandy Oaks Dr
- 8412 S Sandy Oaks Dr
- 8412 S Sandy Oaks Dr
- 8412 Sandy Oaks Dr
- 480 E Sandy Oaks Dr
- 480 Sandy Oaks Dr
- 498 E Sandy Oaks Dr
- 498 Sandy Oaks Dr
- 470 E Sandy Hollow Cir
- 470 Sandy Oaks Dr
Your Personal Tour Guide
Ask me questions while you tour the home.