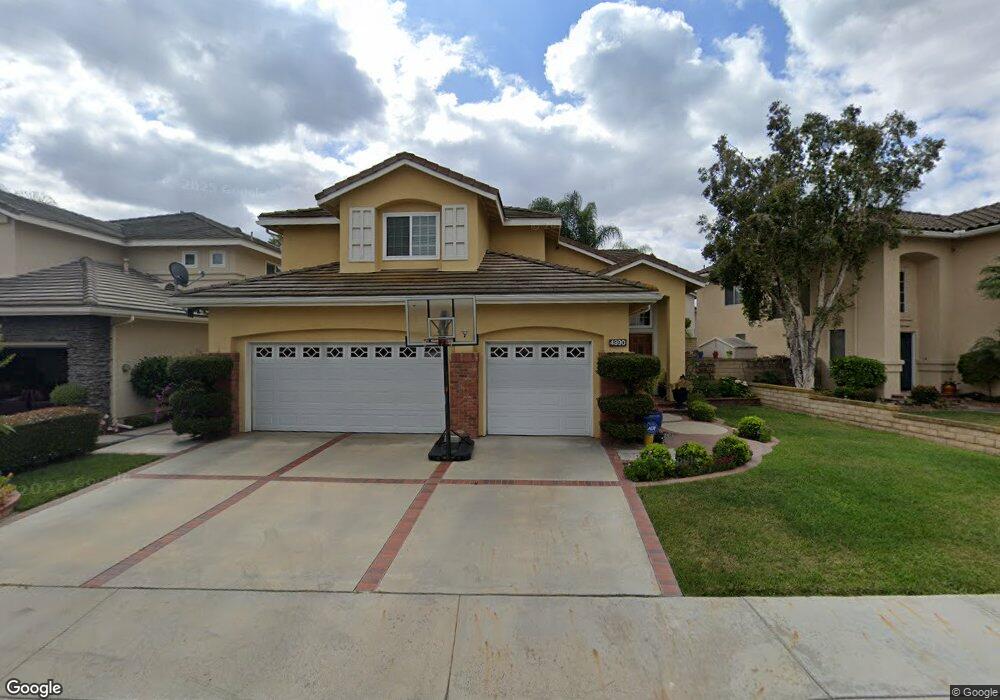
4890 Corso Cir Cypress, CA 90630
Estimated Value: $1,492,660 - $1,641,000
4
Beds
3
Baths
2,440
Sq Ft
$656/Sq Ft
Est. Value
About This Home
This home is located at 4890 Corso Cir, Cypress, CA 90630 and is currently estimated at $1,599,665, approximately $655 per square foot. 4890 Corso Cir is a home located in Orange County with nearby schools including Margaret Landell Elementary School, A.E. Arnold Elementary School, and Lexington Junior High School.
Ownership History
Date
Name
Owned For
Owner Type
Purchase Details
Closed on
Apr 11, 2014
Sold by
Seson Edwin P and Seson Maribel B
Bought by
Seson Family Trust
Current Estimated Value
Purchase Details
Closed on
Aug 1, 2003
Sold by
Seson Edwin P and Seson Maribel B
Bought by
Seson Edwin P and Seson Maribel B
Home Financials for this Owner
Home Financials are based on the most recent Mortgage that was taken out on this home.
Original Mortgage
$177,000
Interest Rate
5.17%
Mortgage Type
Purchase Money Mortgage
Purchase Details
Closed on
Oct 24, 2002
Sold by
Seson Edwin P and Seson Maribel B
Bought by
Seson Edwin P and Seson Maribel B
Purchase Details
Closed on
Jun 14, 1994
Sold by
Cypress Homes Inc
Bought by
Seson Edwin P and Seson Maribel B
Create a Home Valuation Report for This Property
The Home Valuation Report is an in-depth analysis detailing your home's value as well as a comparison with similar homes in the area
Home Values in the Area
Average Home Value in this Area
Purchase History
| Date | Buyer | Sale Price | Title Company |
|---|---|---|---|
| Seson Family Trust | -- | None Available | |
| Seson Edwin P | -- | United Title Company | |
| Seson Edwin P | -- | -- | |
| Seson Edwin P | $305,000 | -- |
Source: Public Records
Mortgage History
| Date | Status | Borrower | Loan Amount |
|---|---|---|---|
| Closed | Seson Edwin P | $177,000 |
Source: Public Records
Tax History
| Year | Tax Paid | Tax Assessment Tax Assessment Total Assessment is a certain percentage of the fair market value that is determined by local assessors to be the total taxable value of land and additions on the property. | Land | Improvement |
|---|---|---|---|---|
| 2025 | $5,805 | $515,620 | $167,800 | $347,820 |
| 2024 | $5,805 | $505,510 | $164,510 | $341,000 |
| 2023 | $5,671 | $495,599 | $161,285 | $334,314 |
| 2022 | $5,604 | $485,882 | $158,123 | $327,759 |
| 2021 | $5,529 | $476,355 | $155,022 | $321,333 |
| 2020 | $5,507 | $471,471 | $153,432 | $318,039 |
| 2019 | $5,352 | $462,227 | $150,424 | $311,803 |
| 2018 | $5,279 | $453,164 | $147,474 | $305,690 |
| 2017 | $5,097 | $444,279 | $144,582 | $299,697 |
| 2016 | $5,054 | $435,568 | $141,747 | $293,821 |
| 2015 | $5,016 | $429,026 | $139,618 | $289,408 |
| 2014 | $6,040 | $420,622 | $136,883 | $283,739 |
Source: Public Records
Map
Nearby Homes
- 9598 Naples Dr
- 4790 Montefino Dr
- 4644 Portofino Cir
- 5068 Cumberland Dr
- 5000 Clementine Ln
- 6007 Clementine Ln Unit 21
- Plan A1 at Citrus Square - Cerise
- Plan A2 at Citrus Square - Cerise
- 9001 Cerise Ln Unit 109
- 9001 Cerise Ln Unit 113
- 5353 Cumberland Dr
- 10292 Ethel St
- 9220 Whitney Way
- 5372 Harvard Way
- 4823 Fieldbrook Ln Unit 24
- 4305 Larwin Ave
- 4238 Via Largo
- 9066 Candlestick Ln Unit 5
- 10446 Julie Beth Cir
- 4194 Paseo de Oro
Your Personal Tour Guide
Ask me questions while you tour the home.