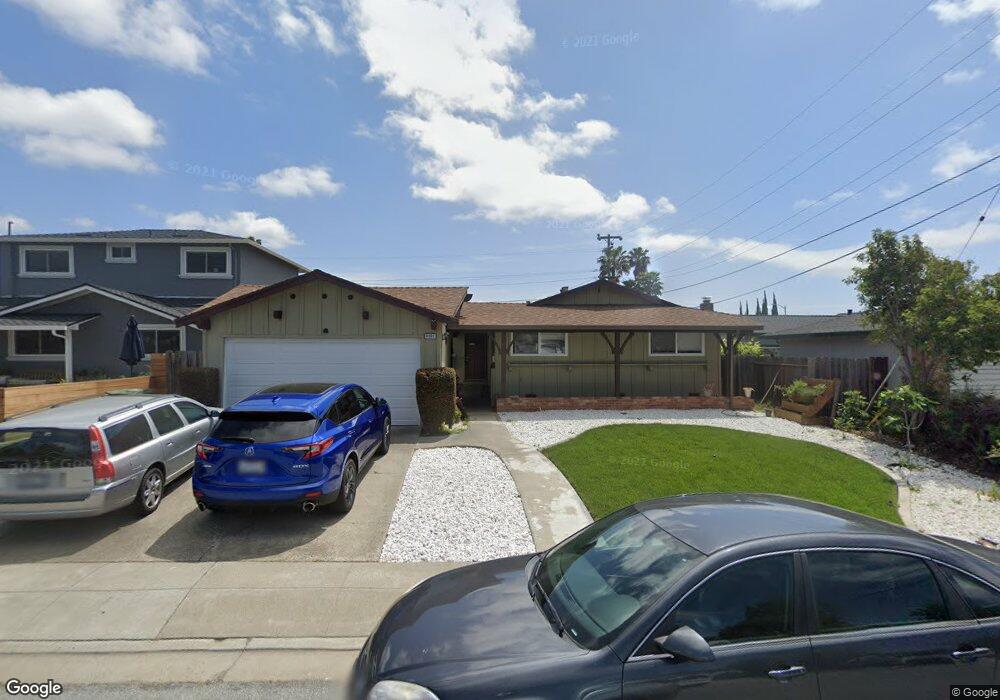
4893 Regents Park Ln Fremont, CA 94538
Blacow NeighborhoodEstimated Value: $1,519,000 - $1,672,000
4
Beds
3
Baths
1,552
Sq Ft
$1,028/Sq Ft
Est. Value
About This Home
This home is located at 4893 Regents Park Ln, Fremont, CA 94538 and is currently estimated at $1,594,681, approximately $1,027 per square foot. 4893 Regents Park Ln is a home located in Alameda County with nearby schools including Steven Millard Elementary, G.M. Walters Middle School, and John F. Kennedy High School.
Ownership History
Date
Name
Owned For
Owner Type
Purchase Details
Closed on
Aug 27, 2013
Sold by
Ho Chiem Wendy and Ho Chiem
Bought by
Neil Jason T O and Neil Daniela V O
Current Estimated Value
Home Financials for this Owner
Home Financials are based on the most recent Mortgage that was taken out on this home.
Original Mortgage
$650,000
Outstanding Balance
$484,282
Interest Rate
4.36%
Mortgage Type
VA
Estimated Equity
$1,110,399
Purchase Details
Closed on
Jun 3, 2013
Sold by
Lam Hoa
Bought by
Chiem Ho
Home Financials for this Owner
Home Financials are based on the most recent Mortgage that was taken out on this home.
Original Mortgage
$340,000
Interest Rate
3.38%
Mortgage Type
New Conventional
Purchase Details
Closed on
May 20, 2013
Sold by
Hobbs Monty and The Regents Company Trust
Bought by
Ho Chiem Wendy and Ho Chiem
Home Financials for this Owner
Home Financials are based on the most recent Mortgage that was taken out on this home.
Original Mortgage
$340,000
Interest Rate
3.38%
Mortgage Type
New Conventional
Create a Home Valuation Report for This Property
The Home Valuation Report is an in-depth analysis detailing your home's value as well as a comparison with similar homes in the area
Home Values in the Area
Average Home Value in this Area
Purchase History
| Date | Buyer | Sale Price | Title Company |
|---|---|---|---|
| Neil Jason T O | $652,000 | Cornerstone Title Company | |
| Chiem Ho | -- | Cornerstone Title Company | |
| Ho Chiem Wendy | $490,000 | Cornerstone Title Company |
Source: Public Records
Mortgage History
| Date | Status | Borrower | Loan Amount |
|---|---|---|---|
| Open | Neil Jason T O | $650,000 | |
| Previous Owner | Ho Chiem Wendy | $340,000 |
Source: Public Records
Tax History Compared to Growth
Tax History
| Year | Tax Paid | Tax Assessment Tax Assessment Total Assessment is a certain percentage of the fair market value that is determined by local assessors to be the total taxable value of land and additions on the property. | Land | Improvement |
|---|---|---|---|---|
| 2025 | $9,663 | $795,833 | $239,768 | $563,065 |
| 2024 | $9,663 | $780,095 | $235,068 | $552,027 |
| 2023 | $9,403 | $771,664 | $230,459 | $541,205 |
| 2022 | $9,279 | $749,535 | $225,941 | $530,594 |
| 2021 | $9,051 | $734,707 | $221,513 | $520,194 |
| 2020 | $9,070 | $734,103 | $219,242 | $514,861 |
| 2019 | $8,966 | $719,714 | $214,944 | $504,770 |
| 2018 | $8,790 | $705,606 | $210,731 | $494,875 |
| 2017 | $8,570 | $691,774 | $206,600 | $485,174 |
| 2016 | $8,423 | $678,210 | $202,549 | $475,661 |
| 2015 | $8,310 | $668,026 | $199,508 | $468,518 |
| 2014 | $8,131 | $652,000 | $195,600 | $456,400 |
Source: Public Records
Map
Nearby Homes
- 43163 Grimmer Terrace
- 48 Eagle Green
- 42932 Peachwood St
- 92 Delta Green
- 4860 Bryce Canyon Park Dr
- 4537 Capewood Terrace
- 4533 Capewood Terrace
- 5341 Audubon Park Ct
- 4309 Bora Ave
- 202 Manitoba Terrace
- 5560 Boscell Common
- 262 Manitoba Green
- 208 Manitoba Terrace
- 261 Manitoba Green Unit 261
- 257 Manitoba Green
- 4751 Wadsworth Ct
- 41882 Gifford St
- 40696 Robin St
- 42759 Newport Dr
- 40422 Landon Ave
- 4891 Regents Park Ln
- 4897 Regents Park Ln
- 43133 Isle Royal St
- 4889 Regents Park Ln
- 4894 Regents Park Ln
- 4892 Regents Park Ln
- 4898 Regents Park Ln
- 4885 Regents Park Ln
- 43145 Grandbrook Park Ct
- 4888 Regents Park Ln
- 4886 Regents Park Ln
- 4853 Regents Park Ln
- 43155 Isle Royal St
- 4851 Regents Park Ln
- 4857 Regents Park Ln
- 43151 Grandbrook Park Ct
- 4882 Seneca Park Ave
- 4890 Seneca Park Ave
- 4874 Seneca Park Ave
- 4849 Regents Park Ln