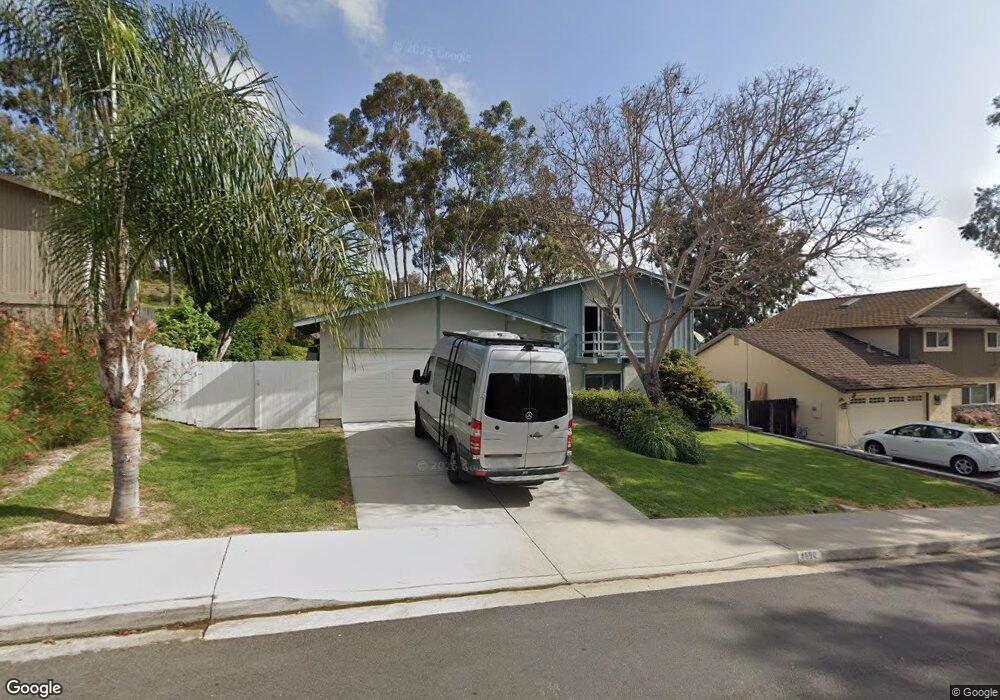
4894 Alondra Way Carlsbad, CA 92008
Hedionda Point NeighborhoodEstimated Value: $1,419,000 - $1,551,000
4
Beds
2
Baths
1,882
Sq Ft
$794/Sq Ft
Est. Value
About This Home
This home is located at 4894 Alondra Way, Carlsbad, CA 92008 and is currently estimated at $1,494,452, approximately $794 per square foot. 4894 Alondra Way is a home located in San Diego County with nearby schools including Kelly Elementary School, Carlsbad High School, and Sage Creek High.
Ownership History
Date
Name
Owned For
Owner Type
Purchase Details
Closed on
Oct 19, 2007
Sold by
Vidakovich Chaundra and Vidakovich Paul S
Bought by
Vidakovich Paul S and Vidakovich Chaundra
Current Estimated Value
Home Financials for this Owner
Home Financials are based on the most recent Mortgage that was taken out on this home.
Original Mortgage
$504,000
Outstanding Balance
$325,416
Interest Rate
6.87%
Mortgage Type
New Conventional
Estimated Equity
$1,169,036
Purchase Details
Closed on
May 16, 2007
Sold by
Vidakovich Paul S
Bought by
Vidakovich Paul S and Vidakovich Chaundra
Purchase Details
Closed on
Mar 15, 2002
Sold by
Charney Mark R and Charney Patti K
Bought by
Vidakovich Paul S
Home Financials for this Owner
Home Financials are based on the most recent Mortgage that was taken out on this home.
Original Mortgage
$279,000
Interest Rate
6.12%
Purchase Details
Closed on
Oct 20, 1988
Create a Home Valuation Report for This Property
The Home Valuation Report is an in-depth analysis detailing your home's value as well as a comparison with similar homes in the area
Home Values in the Area
Average Home Value in this Area
Purchase History
| Date | Buyer | Sale Price | Title Company |
|---|---|---|---|
| Vidakovich Paul S | -- | Fidelity National Title Co | |
| Vidakovich Chaundra | -- | Fidelity National Title Co | |
| Vidakovich Paul S | -- | None Available | |
| Vidakovich Paul S | $379,000 | Chicago Title Co | |
| -- | $210,000 | -- |
Source: Public Records
Mortgage History
| Date | Status | Borrower | Loan Amount |
|---|---|---|---|
| Open | Vidakovich Chaundra | $504,000 | |
| Closed | Vidakovich Paul S | $279,000 |
Source: Public Records
Tax History Compared to Growth
Tax History
| Year | Tax Paid | Tax Assessment Tax Assessment Total Assessment is a certain percentage of the fair market value that is determined by local assessors to be the total taxable value of land and additions on the property. | Land | Improvement |
|---|---|---|---|---|
| 2025 | $5,936 | $559,872 | $324,992 | $234,880 |
| 2024 | $5,936 | $548,895 | $318,620 | $230,275 |
| 2023 | $5,906 | $538,133 | $312,373 | $225,760 |
| 2022 | $5,816 | $527,583 | $306,249 | $221,334 |
| 2021 | $5,773 | $517,240 | $300,245 | $216,995 |
| 2020 | $5,734 | $511,937 | $297,167 | $214,770 |
| 2019 | $5,632 | $501,900 | $291,341 | $210,559 |
| 2018 | $5,396 | $492,060 | $285,629 | $206,431 |
| 2017 | $5,307 | $482,413 | $280,029 | $202,384 |
| 2016 | $5,096 | $472,955 | $274,539 | $198,416 |
| 2015 | $5,076 | $465,852 | $270,416 | $195,436 |
| 2014 | $4,992 | $456,727 | $265,119 | $191,608 |
Source: Public Records
Map
Nearby Homes
- 4814 Refugio Ave
- 4876 Park Dr
- 4874 Park Dr
- 4843 Flying Cloud Way
- 0 Park Dr
- 0 Sunny Creek Unit PI25230627
- 4781 Argosy Ln
- 2508 Chamomile Ln
- 2559 Delphinium Ln
- 2541 Delphinium Ln
- 2513 Delphinium Ln
- 4672 Catmint Ln
- 4700 Parsley Ln
- 4735 Bryce Cir
- 4806 Parsley Ln
- 4623 Telescope Ave
- 4640 Sunburst Rd
- Plan 1732 Modeled at Coral Ridge
- Plan 1739 Modeled at Coral Ridge
- Plan 1688 Modeled at Coral Ridge
- 4896 Alondra Way
- 4892 Alondra Way
- 4890 Alondra Way
- 4890 Park Dr
- 4889 Alondra Way
- 4886 Alondra Way
- 4888 Park Dr
- 4885 Alondra Way
- 4882 Alondra Way
- 4889 Sevilla Way
- 4891 Sevilla Way
- 4885 Sevilla Way
- 4879 Alondra Way
- 4895 Sevilla Way
- 4886 Park Dr
- 4881 Sevilla Way
- 4880 Alondra Way
- 4879 Sevilla Way
- 4875 Alondra Way
- 4899 Sevilla Way