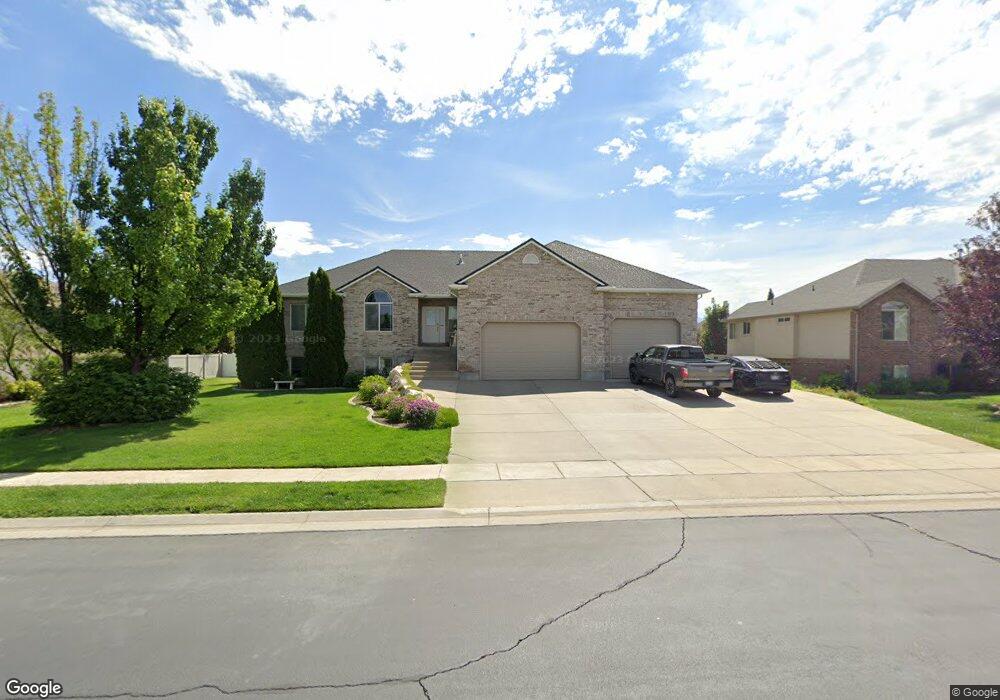
4894 S 5300 W Hooper, UT 84315
Estimated Value: $787,000 - $866,000
6
Beds
5
Baths
4,312
Sq Ft
$188/Sq Ft
Est. Value
About This Home
This home is located at 4894 S 5300 W, Hooper, UT 84315 and is currently estimated at $812,661, approximately $188 per square foot. 4894 S 5300 W is a home located in Weber County with nearby schools including Hooper Elementary School, Rocky Mountain Junior High School, and Quest Academy.
Ownership History
Date
Name
Owned For
Owner Type
Purchase Details
Closed on
Jan 2, 2014
Sold by
Shellabarger Brian
Bought by
Grygier Jim F and Grygier Lori D
Current Estimated Value
Home Financials for this Owner
Home Financials are based on the most recent Mortgage that was taken out on this home.
Original Mortgage
$350,831
Outstanding Balance
$262,605
Interest Rate
4.17%
Mortgage Type
VA
Estimated Equity
$550,056
Purchase Details
Closed on
Mar 15, 2010
Sold by
Shellabarger Brian and Shellabarger Melanie
Bought by
Shellabarger Brian
Home Financials for this Owner
Home Financials are based on the most recent Mortgage that was taken out on this home.
Original Mortgage
$397,664
Interest Rate
5%
Mortgage Type
FHA
Purchase Details
Closed on
Jun 1, 2006
Sold by
Shellabarger Brian
Bought by
Shellabarger Brian and Shellabarger Melanie
Home Financials for this Owner
Home Financials are based on the most recent Mortgage that was taken out on this home.
Original Mortgage
$304,000
Interest Rate
7%
Mortgage Type
Fannie Mae Freddie Mac
Purchase Details
Closed on
May 19, 2006
Sold by
Behrman Marty and Behrman Rebecca
Bought by
Shellabarger Brian
Home Financials for this Owner
Home Financials are based on the most recent Mortgage that was taken out on this home.
Original Mortgage
$304,000
Interest Rate
7%
Mortgage Type
Fannie Mae Freddie Mac
Purchase Details
Closed on
Aug 18, 2005
Sold by
Behrman Marty
Bought by
Behrman Marty and Behrman Rebecca
Home Financials for this Owner
Home Financials are based on the most recent Mortgage that was taken out on this home.
Original Mortgage
$69,000
Interest Rate
5.12%
Mortgage Type
Stand Alone Second
Purchase Details
Closed on
Aug 11, 2005
Sold by
Nielsen Lance K
Bought by
Nielsen Lance K and Conrad Wendi N
Home Financials for this Owner
Home Financials are based on the most recent Mortgage that was taken out on this home.
Original Mortgage
$69,000
Interest Rate
5.12%
Mortgage Type
Stand Alone Second
Purchase Details
Closed on
Aug 3, 2004
Sold by
Haws Development Corp
Bought by
Behrman Marty
Create a Home Valuation Report for This Property
The Home Valuation Report is an in-depth analysis detailing your home's value as well as a comparison with similar homes in the area
Home Values in the Area
Average Home Value in this Area
Purchase History
| Date | Buyer | Sale Price | Title Company |
|---|---|---|---|
| Grygier Jim F | -- | Preferred Title And Escrow I | |
| Shellabarger Brian | -- | Inwest Title Ogden | |
| Shellabarger Brian | -- | Accommodation | |
| Shellabarger Brian | -- | First American Title | |
| Behrman Marty | -- | Pinnacle Title | |
| Nielsen Lance K | -- | Bonneville Title Company Sal | |
| Behrman Marty | -- | Hickman Title |
Source: Public Records
Mortgage History
| Date | Status | Borrower | Loan Amount |
|---|---|---|---|
| Open | Grygier Jim F | $350,831 | |
| Previous Owner | Shellabarger Brian | $397,664 | |
| Previous Owner | Shellabarger Brian | $304,000 | |
| Previous Owner | Nielsen Lance K | $69,000 | |
| Previous Owner | Nielsen Lance K | $276,000 |
Source: Public Records
Tax History
| Year | Tax Paid | Tax Assessment Tax Assessment Total Assessment is a certain percentage of the fair market value that is determined by local assessors to be the total taxable value of land and additions on the property. | Land | Improvement |
|---|---|---|---|---|
| 2025 | $4,497 | $784,222 | $227,227 | $556,995 |
| 2024 | $4,325 | $422,398 | $124,974 | $297,424 |
| 2023 | $4,137 | $400,401 | $124,231 | $276,170 |
| 2022 | $4,300 | $425,700 | $101,755 | $323,945 |
| 2021 | $3,872 | $646,000 | $119,517 | $526,483 |
| 2020 | $3,552 | $543,001 | $99,329 | $443,672 |
| 2019 | $3,681 | $532,000 | $98,544 | $433,456 |
| 2018 | $3,841 | $530,999 | $78,361 | $452,638 |
| 2017 | $3,481 | $466,000 | $76,971 | $389,029 |
| 2016 | $3,159 | $228,332 | $37,096 | $191,236 |
| 2015 | $3,125 | $222,600 | $38,735 | $183,865 |
| 2014 | $2,767 | $191,733 | $30,448 | $161,285 |
Source: Public Records
Map
Nearby Homes
- 4879 S 5050 W
- 4836 S 5050 W
- 3729 S 5600 W Unit 6
- 3720 S 5600 W Unit 2
- 3732 S 5600 W Unit 3
- 3719 S 5600 W Unit 7
- 3632 S 5400 W
- 4931 S 4700 W
- 5335 W 5500 S
- 5957 W 4700 S
- 4488 W 4950 S
- 4700 W 5500 S
- 4111 S 5350 W
- 0 W 5500 S
- 4129 S 5800 W Unit 4
- 4146 S 5800 W Unit 5
- 4194 S 5800 W Unit 14
- 4168 S 5800 W Unit 12
- 4179 S 5800 W Unit 1
- 4163 S 5800 W Unit 2
- 4916 S 5300 W
- 4872 S 5300 W
- 4895 S 5225 W
- 4938 S 5300 W
- 4909 S 5300 W
- 4909 S 5300 W Unit 38
- 4873 S 5225 W
- 4919 S 5225 W
- 5277 W 4825 S
- 5277 W 4825 S Unit 40
- 4850 S 5300 W
- 4432 S 5400 W
- 4862 S 5400 W
- 4863 S 5225 W
- 4929 S 5300 W
- 4929 S 5300 W Unit 37
- 4939 S 5225 W
- 4876 S 5400 W
- 4949 S 5300 W
- 4949 S 5300 W Unit 36
Your Personal Tour Guide
Ask me questions while you tour the home.