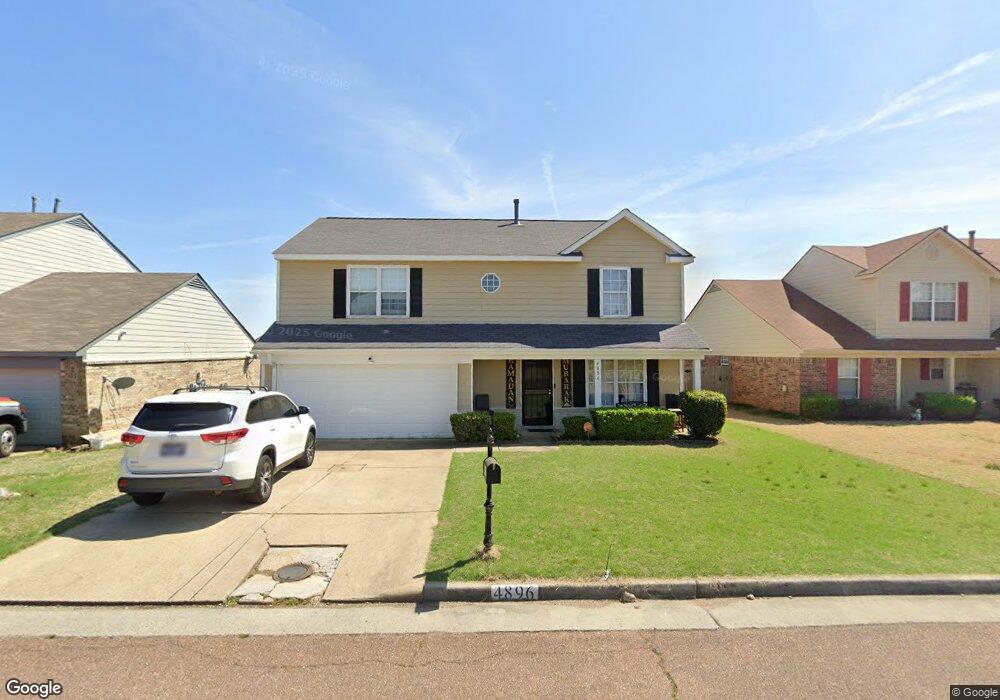
4896 Top Notch Loop Memphis, TN 38125
Southern Shelby County NeighborhoodEstimated Value: $238,625 - $265,000
4
Beds
3
Baths
1,914
Sq Ft
$131/Sq Ft
Est. Value
About This Home
This home is located at 4896 Top Notch Loop, Memphis, TN 38125 and is currently estimated at $251,156, approximately $131 per square foot. 4896 Top Notch Loop is a home located in Shelby County with nearby schools including Southwind Elementary School, Highland Oaks Middle School, and Southwind High School.
Ownership History
Date
Name
Owned For
Owner Type
Purchase Details
Closed on
Feb 28, 2011
Sold by
Caruthers Jerry R
Bought by
Sow Boubacar and Sow Diariou
Current Estimated Value
Home Financials for this Owner
Home Financials are based on the most recent Mortgage that was taken out on this home.
Original Mortgage
$97,465
Outstanding Balance
$68,230
Interest Rate
5.35%
Mortgage Type
FHA
Estimated Equity
$182,926
Purchase Details
Closed on
Dec 15, 2008
Sold by
Crawford Dale Wayne and Crawford Rhonda Rochelle
Bought by
Caruthers Jerry R
Purchase Details
Closed on
Oct 24, 2005
Sold by
Cccs Homes Llc
Bought by
Caruthers Jerry R
Purchase Details
Closed on
May 17, 2004
Sold by
Caruthers Jerry R
Bought by
Cccs Homes Llc
Purchase Details
Closed on
Aug 29, 2003
Sold by
Ivey Jeffrey Lynn and Ivey Vanessa
Bought by
Hud
Purchase Details
Closed on
Aug 30, 2001
Sold by
Crossmann Communities Of Tennessee Llc
Bought by
Ivey Jeffrey Lynn and Ivey Vanessa
Home Financials for this Owner
Home Financials are based on the most recent Mortgage that was taken out on this home.
Original Mortgage
$149,219
Interest Rate
6.98%
Mortgage Type
FHA
Create a Home Valuation Report for This Property
The Home Valuation Report is an in-depth analysis detailing your home's value as well as a comparison with similar homes in the area
Home Values in the Area
Average Home Value in this Area
Purchase History
| Date | Buyer | Sale Price | Title Company |
|---|---|---|---|
| Sow Boubacar | $100,000 | Executive Title & Closing | |
| Caruthers Jerry R | $79,151 | None Available | |
| Caruthers Jerry R | -- | -- | |
| Cccs Homes Llc | -- | -- | |
| Hud | $155,862 | -- | |
| Ivey Jeffrey Lynn | $151,561 | Fidelity Title & Escrow Inc | |
| Ivey Jeffrey Lynn | $151,561 | Fidelity Title & Escrow Inc |
Source: Public Records
Mortgage History
| Date | Status | Borrower | Loan Amount |
|---|---|---|---|
| Open | Sow Boubacar | $97,465 | |
| Previous Owner | Ivey Jeffrey Lynn | $149,219 |
Source: Public Records
Tax History
| Year | Tax Paid | Tax Assessment Tax Assessment Total Assessment is a certain percentage of the fair market value that is determined by local assessors to be the total taxable value of land and additions on the property. | Land | Improvement |
|---|---|---|---|---|
| 2025 | $1,497 | $70,150 | $11,500 | $58,650 |
| 2024 | $1,497 | $44,150 | $8,500 | $35,650 |
| 2023 | $1,497 | $44,150 | $8,500 | $35,650 |
| 2022 | $1,497 | $44,150 | $8,500 | $35,650 |
| 2021 | $1,523 | $44,150 | $8,500 | $35,650 |
| 2020 | $1,374 | $33,925 | $8,500 | $25,425 |
| 2019 | $1,374 | $33,925 | $8,500 | $25,425 |
| 2018 | $1,374 | $33,925 | $8,500 | $25,425 |
| 2017 | $1,394 | $33,925 | $8,500 | $25,425 |
| 2016 | $1,277 | $29,225 | $0 | $0 |
| 2014 | $1,277 | $29,225 | $0 | $0 |
Source: Public Records
Map
Nearby Homes
- 4908 Top Notch Loop
- 7848 Pinefrost Ln
- 7608 Comstock Cove
- 4883 Saddlehorn Cove
- 7763 Shadowcrest Rd
- 7518 Harvest Park Cove
- 7703 Driscoll St
- 5094 Denton Cove N
- 7709 Canyon Ridge Cove
- 5167 Silver Peak Ln
- 5167 Grand Pines Dr
- 4580 Wood Fox Cove
- 7407 Heather Knoll Cove
- 7743 Freehold Dr
- 4502 Sweet Whisper Cove
- 7415 Red River Dr
- 4735 Harvest Knoll Cove N
- 7656 Glen Laurel Way
- 7661 Brookbriar Cove
- 4419 Berkley Woods Dr
- 4890 Top Notch Loop
- 4904 Top Notch Loop
- 4887 Ridge Walk Dr
- 4891 Ridge Walk Ln
- 4886 Top Notch Loop
- 4891 Ridge Walk Dr
- 4879 Ridge Walk Dr
- 4879 Ridge Walk Ln
- 4895 Top Notch Loop
- 4901 Top Notch Loop
- 4891 Top Notch Loop
- 4873 Ridge Walk Dr
- 4897 Ridge Walk Dr
- 4905 Top Notch Loop
- 4873 Ridge Walk Ln
- 4897 Ridge Walk Ln
- 4880 Top Notch Loop
- 4885 Top Notch Loop
- 4867 Ridge Walk Ln
- 4867 Ridge Walk Dr
Your Personal Tour Guide
Ask me questions while you tour the home.