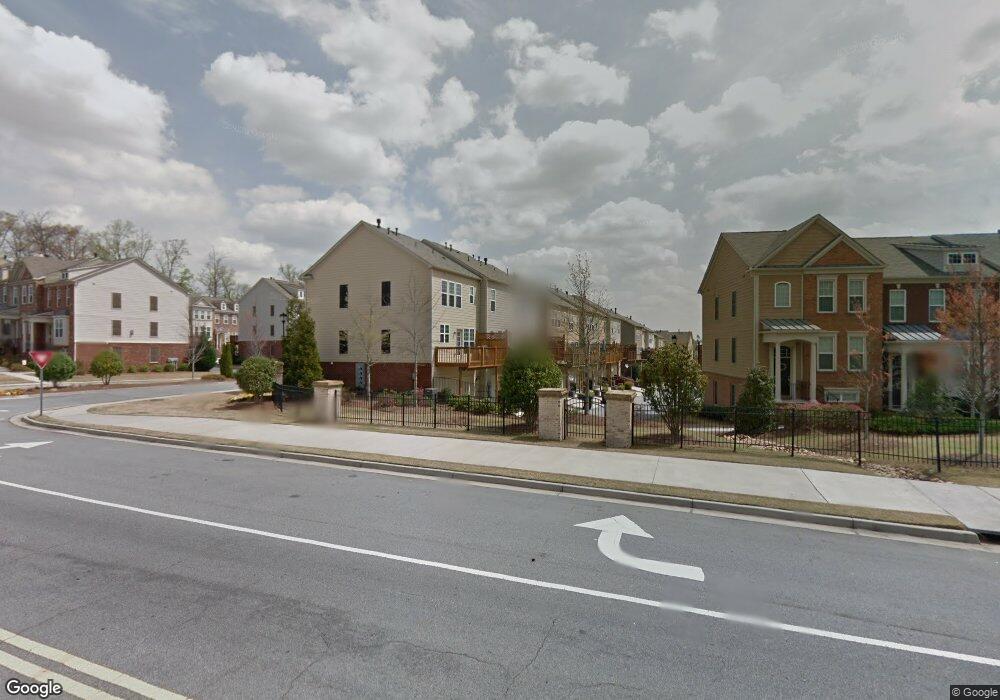
4899 Seldon Way SE Unit 4 Smyrna, GA 30080
Estimated Value: $405,666 - $414,000
3
Beds
4
Baths
1,901
Sq Ft
$215/Sq Ft
Est. Value
About This Home
This home is located at 4899 Seldon Way SE Unit 4, Smyrna, GA 30080 and is currently estimated at $408,917, approximately $215 per square foot. 4899 Seldon Way SE Unit 4 is a home located in Cobb County with nearby schools including Nickajack Elementary School, Campbell Middle School, and Campbell High School.
Ownership History
Date
Name
Owned For
Owner Type
Purchase Details
Closed on
Jul 17, 2025
Sold by
Defrances John A
Bought by
Tinch Hillary M
Current Estimated Value
Home Financials for this Owner
Home Financials are based on the most recent Mortgage that was taken out on this home.
Original Mortgage
$389,405
Outstanding Balance
$388,746
Interest Rate
6.85%
Mortgage Type
New Conventional
Estimated Equity
$20,171
Purchase Details
Closed on
Apr 20, 2018
Sold by
Timmons Anderson H
Bought by
Defrances John A
Home Financials for this Owner
Home Financials are based on the most recent Mortgage that was taken out on this home.
Original Mortgage
$250,650
Interest Rate
4.45%
Mortgage Type
New Conventional
Purchase Details
Closed on
Jun 5, 2015
Sold by
Davis Courtenay L
Bought by
Timmons Anderson H and Timmons Leigh T
Home Financials for this Owner
Home Financials are based on the most recent Mortgage that was taken out on this home.
Original Mortgage
$223,250
Interest Rate
3.88%
Mortgage Type
New Conventional
Purchase Details
Closed on
Sep 28, 2011
Sold by
Pulte Home Corp
Bought by
Davis Courtenay L
Home Financials for this Owner
Home Financials are based on the most recent Mortgage that was taken out on this home.
Original Mortgage
$176,130
Interest Rate
4.26%
Mortgage Type
New Conventional
Create a Home Valuation Report for This Property
The Home Valuation Report is an in-depth analysis detailing your home's value as well as a comparison with similar homes in the area
Home Values in the Area
Average Home Value in this Area
Purchase History
| Date | Buyer | Sale Price | Title Company |
|---|---|---|---|
| Tinch Hillary M | $409,900 | None Listed On Document | |
| Tinch Hillary M | $409,900 | None Listed On Document | |
| Defrances John A | $278,500 | -- | |
| Timmons Anderson H | $235,000 | -- | |
| Davis Courtenay L | $185,400 | -- |
Source: Public Records
Mortgage History
| Date | Status | Borrower | Loan Amount |
|---|---|---|---|
| Open | Tinch Hillary M | $389,405 | |
| Closed | Tinch Hillary M | $389,405 | |
| Previous Owner | Defrances John A | $250,650 | |
| Previous Owner | Timmons Anderson H | $223,250 | |
| Previous Owner | Davis Courtenay L | $176,130 |
Source: Public Records
Tax History Compared to Growth
Tax History
| Year | Tax Paid | Tax Assessment Tax Assessment Total Assessment is a certain percentage of the fair market value that is determined by local assessors to be the total taxable value of land and additions on the property. | Land | Improvement |
|---|---|---|---|---|
| 2025 | $4,118 | $163,212 | $26,000 | $137,212 |
| 2024 | $4,121 | $163,212 | $26,000 | $137,212 |
| 2023 | $3,578 | $163,212 | $26,000 | $137,212 |
| 2022 | $3,641 | $139,900 | $26,000 | $113,900 |
| 2021 | $3,210 | $120,204 | $26,000 | $94,204 |
| 2020 | $2,769 | $100,260 | $20,988 | $79,272 |
| 2019 | $3,017 | $111,400 | $23,320 | $88,080 |
| 2018 | $2,684 | $100,752 | $20,000 | $80,752 |
| 2017 | $2,560 | $100,752 | $20,000 | $80,752 |
| 2016 | $2,301 | $88,928 | $20,000 | $68,928 |
| 2015 | $2,620 | $88,928 | $20,000 | $68,928 |
| 2014 | -- | $84,224 | $0 | $0 |
Source: Public Records
Map
Nearby Homes
- 2335 Millhaven St SE
- 2591 Speer Ct SE
- 4652 Prater Way SE
- 2432 Whiteoak Run Unit 20
- 5008 Whiteoak Pointe SE Unit 15
- 2396 Whiteoak Bend SE Unit 16
- 1968 Kenwood Place SE
- 5013 Groover Dr SE
- 5080 Whiteoak Terrace SE
- 1961 Kenwood Rd SE
- 5233 Whiteoak Ave SE
- 4957 Warmstone Way SE Unit 15
- 4957 Warmstone Way SE
- 4805 W Village Way SE Unit 3207
- 4805 W Village Way SE Unit 2204
- 2276 Whiteoak Dr SE
- 2145 W Village Crossing SE
- 2011 Chelton Way SE
- 4651 Eddibunn Dr SE
- 2015 Chelton Way SE
- 4903 Seldon Way SE
- 4895 Seldon Way SE
- 4895 Seldon Way SE Unit 3
- 4895 Seldon Way SE Unit 4895
- 4907 Seldon Way SE
- 4907 Seldon Way SE Unit 6
- 4907 Seldon Way SE Unit 25
- 4891 Seldon Way SE Unit 25
- 4891 Seldon Way SE
- 4887 Seldon Way SE
- 4887 Seldon Way SE Unit 1
- 4911 Seldon Way SE
- 4911 Seldon Way SE Unit 7
- 4911 Seldon Way SE Unit 4911
- 4915 Seldon Way SE
- 4878 Seldon Way SE
- 0 Seldon Way SE Unit 3286181
- 0 Seldon Way SE Unit 3208369
- 0 Seldon Way SE Unit 8397130
- 0 Seldon Way SE Unit 8247610