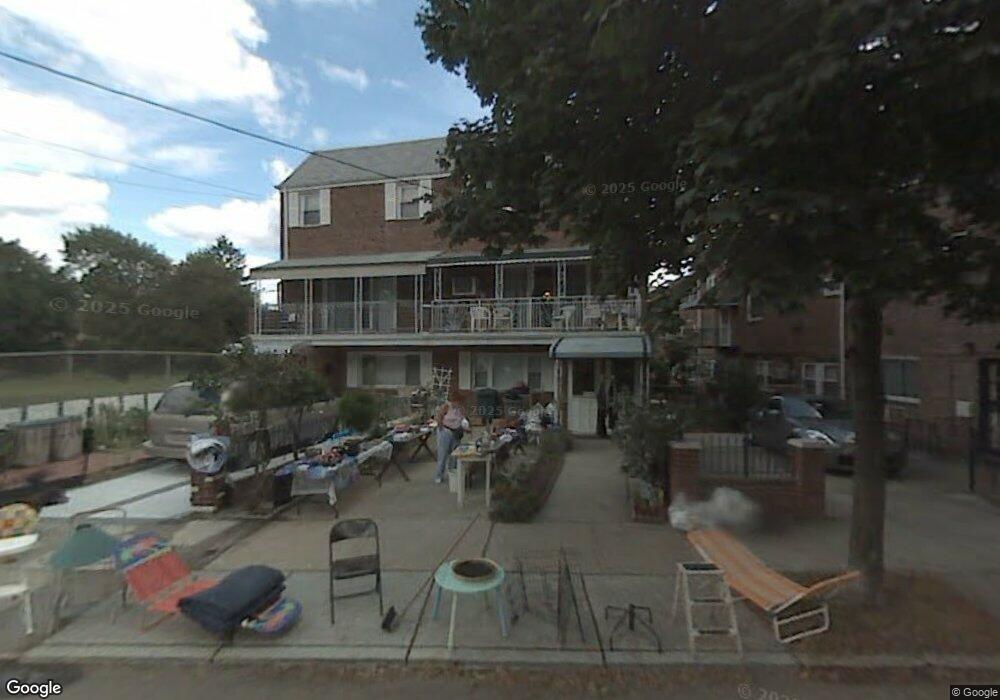
49-49 Fresh Meadow Ln Unit 1 Flushing, NY 11365
Flushing NeighborhoodEstimated Value: $1,096,000 - $1,423,000
2
Beds
1
Bath
800
Sq Ft
$1,536/Sq Ft
Est. Value
About This Home
This home is located at 49-49 Fresh Meadow Ln Unit 1, Flushing, NY 11365 and is currently estimated at $1,228,574, approximately $1,535 per square foot. 49-49 Fresh Meadow Ln Unit 1 is a home located in Queens County with nearby schools including P.S. 162 The John Golden School, George J. Ryan Middle School 216, and Francis Lewis High School.
Ownership History
Date
Name
Owned For
Owner Type
Purchase Details
Closed on
Feb 27, 2023
Sold by
Mavroidis Christine
Bought by
Denise Vlasakakis and Denise John Mavroidis
Current Estimated Value
Purchase Details
Closed on
Feb 15, 2023
Sold by
Mavroidis Christine and Mavroidis Panagiotis
Bought by
Mavroidis Christine
Purchase Details
Closed on
Jul 25, 2006
Sold by
Chen Chen-Kuang
Bought by
Mavroidis Christine and Mavroidis Panagiotis
Home Financials for this Owner
Home Financials are based on the most recent Mortgage that was taken out on this home.
Original Mortgage
$474,000
Interest Rate
6.8%
Mortgage Type
Purchase Money Mortgage
Purchase Details
Closed on
May 12, 2006
Sold by
Chen Chen-Kuang and Lee Chen-Mei
Bought by
Chen Chen-Kuang
Create a Home Valuation Report for This Property
The Home Valuation Report is an in-depth analysis detailing your home's value as well as a comparison with similar homes in the area
Home Values in the Area
Average Home Value in this Area
Purchase History
| Date | Buyer | Sale Price | Title Company |
|---|---|---|---|
| Denise Vlasakakis | -- | -- | |
| Denise Vlasakakis | -- | -- | |
| Mavroidis Christine | -- | -- | |
| Mavroidis Christine | -- | -- | |
| Mavroidis Christine | $725,000 | -- | |
| Mavroidis Christine | $725,000 | -- | |
| Chen Chen-Kuang | $100,000 | -- | |
| Chen Chen-Kuang | $100,000 | -- |
Source: Public Records
Mortgage History
| Date | Status | Borrower | Loan Amount |
|---|---|---|---|
| Previous Owner | Mavroidis Christine | $474,000 |
Source: Public Records
Tax History Compared to Growth
Tax History
| Year | Tax Paid | Tax Assessment Tax Assessment Total Assessment is a certain percentage of the fair market value that is determined by local assessors to be the total taxable value of land and additions on the property. | Land | Improvement |
|---|---|---|---|---|
| 2025 | $10,995 | $55,937 | $12,730 | $43,207 |
| 2024 | $10,995 | $54,743 | $14,678 | $40,065 |
| 2023 | $10,995 | $54,743 | $12,646 | $42,097 |
| 2022 | $9,923 | $72,420 | $18,420 | $54,000 |
| 2021 | $10,398 | $69,780 | $18,420 | $51,360 |
| 2020 | $9,867 | $73,080 | $18,420 | $54,660 |
| 2019 | $9,543 | $80,520 | $18,420 | $62,100 |
| 2018 | $9,299 | $45,619 | $12,802 | $32,817 |
| 2017 | $8,896 | $43,642 | $13,084 | $30,558 |
| 2016 | $8,231 | $43,642 | $13,084 | $30,558 |
| 2015 | $4,966 | $38,845 | $15,769 | $23,076 |
| 2014 | $4,966 | $38,016 | $18,519 | $19,497 |
Source: Public Records
Map
Nearby Homes
- 4953 Fresh Meadow Ln
- 49-75 175th Place
- 50-12 Utopia Pkwy
- 17446 Gladwin Ave
- 5052 Utopia Pkwy
- 173-16 Fairchild Ave
- 48-62 188th St
- 5635 174th St
- 56-35 174th St
- 56-39 175th Place Unit B
- 4919 169th St
- 182-15 58th Ave Unit A
- 16475 Underhill Ave
- 164-75 Underhill Ave
- 16471 Underhill Ave
- 4818 190th St
- 16622 Metcalf Ave
- 47-09 188th St
- 183-26 Booth Memorial Ave
- 19005 48th Ave
- 4949 Fresh Meadow Ln
- 4951 Fresh Meadow Ln Unit 1
- 4951 Fresh Meadow Ln
- 4951 Fresh Meadow Ln
- 17505 Peck Ave
- 17503 Peck Ave
- 17507 Peck Ave
- 175-01 Peck Ave Unit 1
- 17507 Peck Ave
- 17501 Peck Ave
- 17509 Peck Ave
- 17511 Peck Ave
- 17515 Peck Ave
- 175-09 Peck Ave
- 17517 Peck Ave
- 175-21 Fresh Meadow Ln
- 17519 Peck Ave
- 17521 Peck Ave
- 17521 Peck Ave
- 17523 Peck Ave