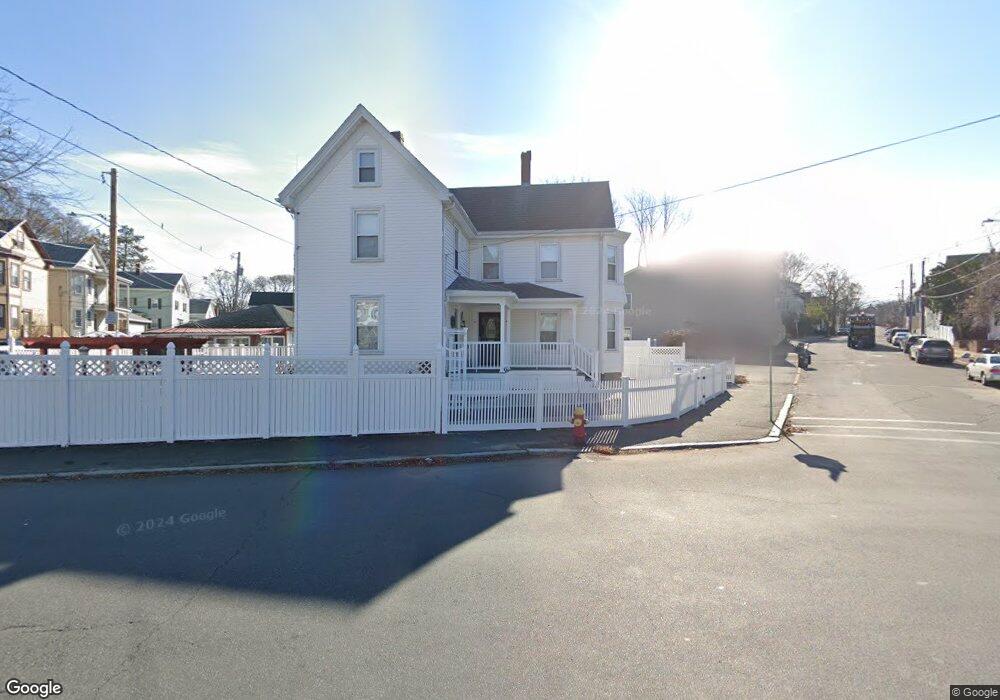
49 Aborn St Peabody, MA 01960
Peabody Town Center NeighborhoodEstimated Value: $579,038 - $684,000
3
Beds
2
Baths
1,400
Sq Ft
$446/Sq Ft
Est. Value
About This Home
This home is located at 49 Aborn St, Peabody, MA 01960 and is currently estimated at $625,010, approximately $446 per square foot. 49 Aborn St is a home located in Essex County with nearby schools including Peabody Veterans Memorial High School, St John The Baptist School, and The Phoenix School.
Ownership History
Date
Name
Owned For
Owner Type
Purchase Details
Closed on
Apr 1, 2009
Sold by
Espinola Connie P
Bought by
Espinola Connie P
Current Estimated Value
Home Financials for this Owner
Home Financials are based on the most recent Mortgage that was taken out on this home.
Original Mortgage
$200,700
Outstanding Balance
$126,738
Interest Rate
4.92%
Mortgage Type
Purchase Money Mortgage
Estimated Equity
$498,272
Purchase Details
Closed on
Jul 9, 1998
Sold by
Finnegan Michael G and Finnegan Mairead
Bought by
Esinola Connie P
Purchase Details
Closed on
Feb 1, 1995
Sold by
Fnma
Bought by
Finnegan Michael G and Finnegan Mairead
Purchase Details
Closed on
Jul 18, 1994
Sold by
Kanellos Arthur J
Bought by
Federal National Mortgage Association
Create a Home Valuation Report for This Property
The Home Valuation Report is an in-depth analysis detailing your home's value as well as a comparison with similar homes in the area
Home Values in the Area
Average Home Value in this Area
Purchase History
| Date | Buyer | Sale Price | Title Company |
|---|---|---|---|
| Espinola Connie P | -- | -- | |
| Esinola Connie P | $157,000 | -- | |
| Finnegan Michael G | $92,500 | -- | |
| Federal National Mortgage Association | $121,000 | -- |
Source: Public Records
Mortgage History
| Date | Status | Borrower | Loan Amount |
|---|---|---|---|
| Open | Federal National Mortgage Association | $200,700 | |
| Previous Owner | Federal National Mortgage Association | $197,700 |
Source: Public Records
Tax History Compared to Growth
Tax History
| Year | Tax Paid | Tax Assessment Tax Assessment Total Assessment is a certain percentage of the fair market value that is determined by local assessors to be the total taxable value of land and additions on the property. | Land | Improvement |
|---|---|---|---|---|
| 2025 | $4,316 | $466,100 | $203,700 | $262,400 |
| 2024 | $4,235 | $464,400 | $203,700 | $260,700 |
| 2023 | $3,960 | $416,000 | $177,200 | $238,800 |
| 2022 | $3,613 | $357,700 | $158,200 | $199,500 |
| 2021 | $3,593 | $342,500 | $143,800 | $198,700 |
| 2020 | $3,518 | $327,600 | $143,800 | $183,800 |
| 2019 | $3,443 | $312,700 | $143,800 | $168,900 |
| 2018 | $3,213 | $280,400 | $135,600 | $144,800 |
| 2017 | $3,213 | $273,200 | $135,600 | $137,600 |
| 2016 | $2,924 | $245,300 | $135,600 | $109,700 |
| 2015 | $3,029 | $246,300 | $135,600 | $110,700 |
Source: Public Records
Map
Nearby Homes
- 2 Osborne St
- 9 Sutton St
- 15 Wall St
- 55 Butler St
- 10 Elliott Place Unit 1R
- 13 State St
- 36 Summit St
- 145 Boston St
- 46 Sutton St
- 128 Boston St Unit 4
- 46 Walnut St
- 111 Foster St Unit 401
- 111 Foster St Unit 416
- 176 Marlborough Rd
- 8 Walnut St Unit 209
- 39 Gallows Hill Rd
- 26 Elm St
- 159 Marlborough Rd
- 23 Proctor St
- 4 Elm St Unit 3
- 5 Shillaber St
- 44 Pierpont St
- 51 Aborn St
- 4 Shillaber St
- 58 Aborn St
- 6 Shillaber St
- 6 Shillaber St Unit 2
- 6 Shillaber St Unit 1
- 7 Shillaber St
- 47 Aborn St
- 55 Aborn St
- 52 Aborn St
- 60 Aborn St
- 46 Pierpont St
- 46 Pierpont St
- 50 1/2 Aborn St
- 7R Shillaber St
- 8 Shillaber St
- 61 Aborn St
- 61 Aborn St Unit 1-2