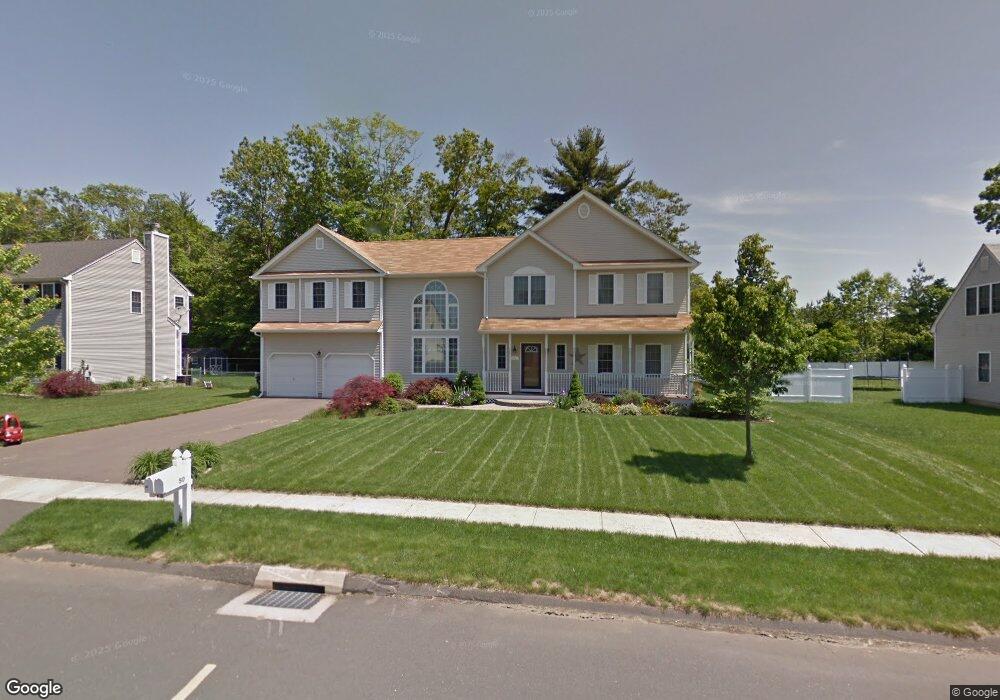
49 Acorn Dr Windsor Locks, CT 06096
Estimated Value: $439,000 - $508,000
3
Beds
3
Baths
1,872
Sq Ft
$251/Sq Ft
Est. Value
About This Home
This home is located at 49 Acorn Dr, Windsor Locks, CT 06096 and is currently estimated at $469,203, approximately $250 per square foot. 49 Acorn Dr is a home located in Hartford County with nearby schools including North Street School, South Elementary School, and Windsor Locks Middle School.
Ownership History
Date
Name
Owned For
Owner Type
Purchase Details
Closed on
Apr 26, 2018
Sold by
Ward Chad M
Bought by
Ward Chad M and Ward Monica D
Current Estimated Value
Purchase Details
Closed on
Jan 31, 2017
Sold by
Ward Chad M
Bought by
Ward Chad M and Dubes-Ward Monica
Purchase Details
Closed on
Mar 3, 2016
Sold by
Olszewski Sheri
Bought by
Ward Chad
Purchase Details
Closed on
Apr 15, 2004
Sold by
T & M Bldg Co
Bought by
Ward Chad and Ward Sheri
Home Financials for this Owner
Home Financials are based on the most recent Mortgage that was taken out on this home.
Original Mortgage
$219,000
Interest Rate
5.58%
Mortgage Type
Purchase Money Mortgage
Create a Home Valuation Report for This Property
The Home Valuation Report is an in-depth analysis detailing your home's value as well as a comparison with similar homes in the area
Home Values in the Area
Average Home Value in this Area
Purchase History
We collect this data history from publicly available records. To have your information removed, we recommend requesting removal directly through your county’s website.
| Date | Buyer | Sale Price | Title Company |
|---|---|---|---|
| Ward Chad M | -- | -- | |
| Ward Chad M | -- | -- | |
| Ward Chad | -- | -- | |
| Ward Chad | $246,500 | -- |
Source: Public Records
Mortgage History
We collect this data history from publicly available records. To have your information removed, we recommend requesting removal directly through your county’s website.
| Date | Status | Borrower | Loan Amount |
|---|---|---|---|
| Previous Owner | Ward Chad | $219,000 |
Source: Public Records
Tax History
| Year | Tax Paid | Tax Assessment Tax Assessment Total Assessment is a certain percentage of the fair market value that is determined by local assessors to be the total taxable value of land and additions on the property. | Land | Improvement |
|---|---|---|---|---|
| 2025 | $8,017 | $334,180 | $64,470 | $269,710 |
| 2024 | $5,385 | $191,380 | $50,080 | $141,300 |
| 2023 | $5,039 | $191,380 | $50,080 | $141,300 |
| 2022 | $4,943 | $191,380 | $50,120 | $141,260 |
| 2021 | $4,943 | $191,380 | $50,120 | $141,260 |
| 2020 | $4,943 | $191,380 | $50,120 | $141,260 |
| 2019 | $4,943 | $191,380 | $50,120 | $141,260 |
| 2017 | $5,233 | $196,300 | $50,000 | $146,300 |
| 2016 | $5,233 | $196,300 | $50,000 | $146,300 |
| 2015 | $5,259 | $196,300 | $50,000 | $146,300 |
| 2014 | $5,456 | $208,000 | $53,800 | $154,200 |
Source: Public Records
Map
Nearby Homes
- 27 Highland Rd
- 31 Ross Way Unit 31
- 39 Chapman Chase Unit 39
- 33 Thomas St
- 50 Chapman Chase Unit 50
- 66 Woodcock Ct Unit 66
- 7 Cannon St
- 23 Ellis St
- 21 Birge Ave
- 235 Reed Ave
- 19 Alberta St
- 433 Reed Ave
- 223 Spring St
- 202 Reed Ave
- 13 Jubrey Ln
- 31 Suffield St
- 404 Woodland St
- 15 Suffield St
- 8 James St
- 6 James St
Your Personal Tour Guide
Ask me questions while you tour the home.