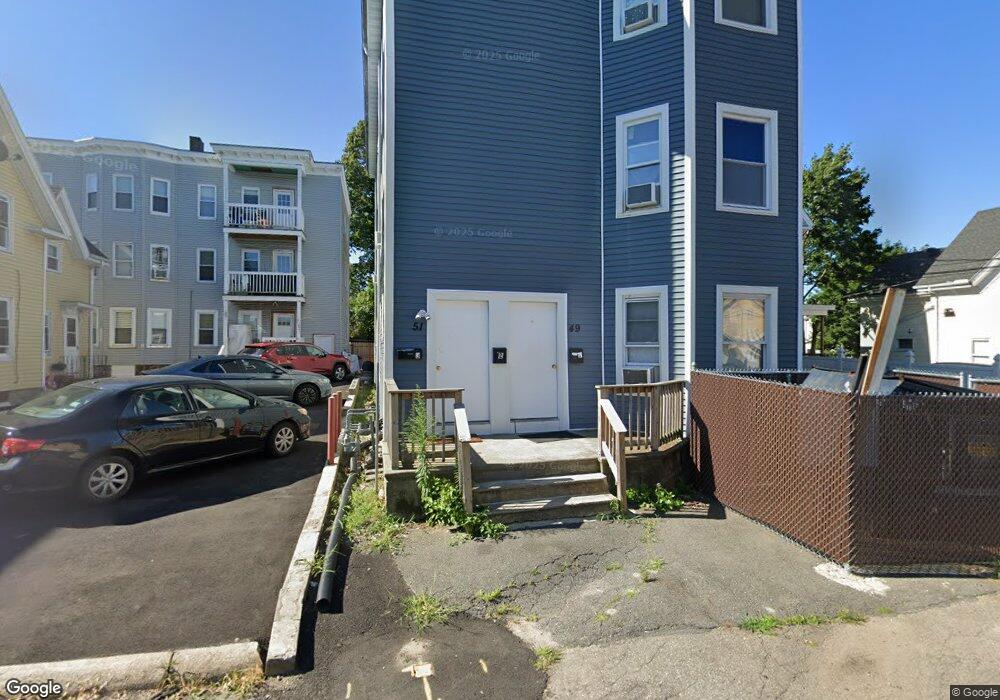
49 Allen St Brockton, MA 02301
Clifton Heights NeighborhoodEstimated Value: $850,000 - $1,097,000
6
Beds
3
Baths
3,606
Sq Ft
$267/Sq Ft
Est. Value
About This Home
This home is located at 49 Allen St, Brockton, MA 02301 and is currently estimated at $962,667, approximately $266 per square foot. 49 Allen St is a home located in Plymouth County with nearby schools including Arnone Elementary School, Joseph F. Plouffe Middle School, and Trinity Catholic Academy.
Ownership History
Date
Name
Owned For
Owner Type
Purchase Details
Closed on
Jan 29, 2020
Sold by
Ponte David and Ponte Sandra M
Bought by
Lafayette Park Llc
Current Estimated Value
Purchase Details
Closed on
May 1, 1997
Sold by
Memn Rt
Bought by
Ponte David and Ponte Sandra M
Home Financials for this Owner
Home Financials are based on the most recent Mortgage that was taken out on this home.
Original Mortgage
$77,160
Interest Rate
7.85%
Mortgage Type
Purchase Money Mortgage
Purchase Details
Closed on
Jun 1, 1993
Sold by
Fhlmc
Bought by
Darosa Jose S and Rosa Manuel
Home Financials for this Owner
Home Financials are based on the most recent Mortgage that was taken out on this home.
Original Mortgage
$36,000
Interest Rate
7.41%
Mortgage Type
Purchase Money Mortgage
Purchase Details
Closed on
Nov 30, 1992
Sold by
Desjarlais Andre
Bought by
Fhlmc
Create a Home Valuation Report for This Property
The Home Valuation Report is an in-depth analysis detailing your home's value as well as a comparison with similar homes in the area
Home Values in the Area
Average Home Value in this Area
Purchase History
| Date | Buyer | Sale Price | Title Company |
|---|---|---|---|
| Lafayette Park Llc | -- | None Available | |
| Ponte David | $77,200 | -- | |
| Darosa Jose S | $45,000 | -- | |
| Fhlmc | $193,249 | -- |
Source: Public Records
Mortgage History
| Date | Status | Borrower | Loan Amount |
|---|---|---|---|
| Previous Owner | Fhlmc | $77,160 | |
| Previous Owner | Fhlmc | $36,000 |
Source: Public Records
Tax History Compared to Growth
Tax History
| Year | Tax Paid | Tax Assessment Tax Assessment Total Assessment is a certain percentage of the fair market value that is determined by local assessors to be the total taxable value of land and additions on the property. | Land | Improvement |
|---|---|---|---|---|
| 2025 | $9,145 | $755,200 | $131,100 | $624,100 |
| 2024 | $8,758 | $728,600 | $131,100 | $597,500 |
| 2023 | $7,937 | $611,500 | $99,200 | $512,300 |
| 2022 | $7,897 | $565,300 | $89,700 | $475,600 |
| 2021 | $5,902 | $407,000 | $73,800 | $333,200 |
| 2020 | $5,433 | $358,600 | $70,200 | $288,400 |
| 2019 | $5,069 | $326,200 | $66,900 | $259,300 |
| 2018 | $4,471 | $288,100 | $66,900 | $221,200 |
| 2017 | $4,471 | $277,700 | $66,900 | $210,800 |
| 2016 | $3,835 | $220,900 | $64,800 | $156,100 |
| 2015 | $3,109 | $171,300 | $64,800 | $106,500 |
| 2014 | $2,886 | $159,200 | $64,800 | $94,400 |
Source: Public Records
Map
Nearby Homes
- 47 Allen St
- 47 Allen St Unit 3
- 47 Allen St Unit 2
- 47 Allen St Unit 1
- 53 Allen St
- 43 Allen St
- 381 Montello St
- 9 Ridgeway Ct
- 50 Allen St
- 17 Ridgeway Ct
- 52 Allen St
- 39 Allen St Unit 3
- 37 Allen St Unit 1
- 39 Allen St Unit 2
- 39 Allen St
- 39 Allen St Unit 1
- 37 Allen St
- 48 Allen St
- 42 Allen St
- 23 Ridgeway Ct Unit 3