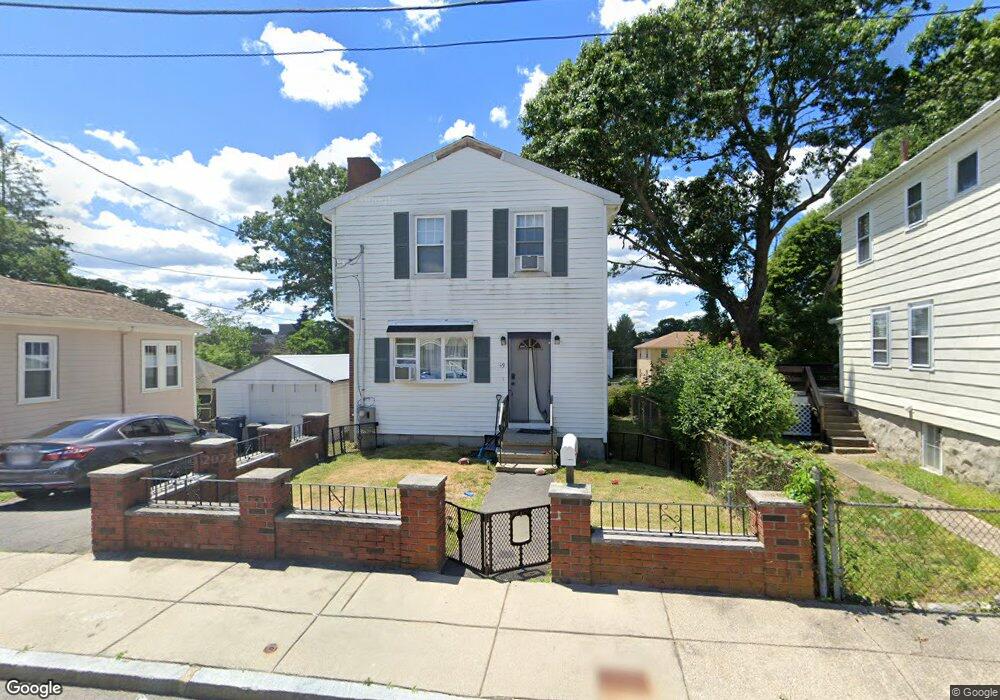
49 Alleyne St Unit 49 West Roxbury, MA 02132
Upper Washington-Spring Street NeighborhoodEstimated Value: $568,000 - $693,000
3
Beds
2
Baths
1,344
Sq Ft
$489/Sq Ft
Est. Value
About This Home
This home is located at 49 Alleyne St Unit 49, West Roxbury, MA 02132 and is currently estimated at $657,668, approximately $489 per square foot. 49 Alleyne St Unit 49 is a home located in Suffolk County with nearby schools including St Theresa School, The Roxbury Latin School, and Catholic Memorial School.
Ownership History
Date
Name
Owned For
Owner Type
Purchase Details
Closed on
Aug 4, 2011
Sold by
Daley Regina
Bought by
Scheffler Max R and Scheffler Ellen R
Current Estimated Value
Home Financials for this Owner
Home Financials are based on the most recent Mortgage that was taken out on this home.
Original Mortgage
$287,174
Outstanding Balance
$198,279
Interest Rate
4.51%
Mortgage Type
Purchase Money Mortgage
Estimated Equity
$459,389
Purchase Details
Closed on
Oct 1, 1996
Sold by
Larosa Dev Corp
Bought by
Daley Regina
Home Financials for this Owner
Home Financials are based on the most recent Mortgage that was taken out on this home.
Original Mortgage
$138,700
Interest Rate
7.83%
Mortgage Type
Purchase Money Mortgage
Purchase Details
Closed on
May 13, 1996
Sold by
Magyar Joanne
Bought by
Larosa Dev Corp
Purchase Details
Closed on
Aug 9, 1993
Sold by
Perkins Roland F Est and Shubert
Bought by
Magyar Joanne
Home Financials for this Owner
Home Financials are based on the most recent Mortgage that was taken out on this home.
Original Mortgage
$25,000
Interest Rate
7.29%
Mortgage Type
Purchase Money Mortgage
Create a Home Valuation Report for This Property
The Home Valuation Report is an in-depth analysis detailing your home's value as well as a comparison with similar homes in the area
Home Values in the Area
Average Home Value in this Area
Purchase History
| Date | Buyer | Sale Price | Title Company |
|---|---|---|---|
| Scheffler Max R | $278,000 | -- | |
| Daley Regina | $146,000 | -- | |
| Larosa Dev Corp | $55,000 | -- | |
| Magyar Joanne | $45,000 | -- |
Source: Public Records
Mortgage History
| Date | Status | Borrower | Loan Amount |
|---|---|---|---|
| Open | Scheffler Max R | $287,174 | |
| Previous Owner | Magyar Joanne | $177,400 | |
| Previous Owner | Magyar Joanne | $138,700 | |
| Previous Owner | Magyar Joanne | $25,000 |
Source: Public Records
Tax History Compared to Growth
Tax History
| Year | Tax Paid | Tax Assessment Tax Assessment Total Assessment is a certain percentage of the fair market value that is determined by local assessors to be the total taxable value of land and additions on the property. | Land | Improvement |
|---|---|---|---|---|
| 2025 | $6,718 | $580,100 | $155,400 | $424,700 |
| 2024 | $5,972 | $547,900 | $166,300 | $381,600 |
| 2023 | $6,265 | $583,300 | $156,900 | $426,400 |
| 2022 | $5,771 | $530,400 | $142,700 | $387,700 |
| 2021 | $6,070 | $568,900 | $138,500 | $430,400 |
| 2020 | $5,102 | $483,100 | $126,700 | $356,400 |
| 2019 | $4,744 | $450,100 | $112,600 | $337,500 |
| 2018 | $4,491 | $428,500 | $112,600 | $315,900 |
| 2017 | $3,695 | $348,900 | $108,400 | $240,500 |
| 2016 | $3,621 | $329,200 | $108,400 | $220,800 |
| 2015 | $3,783 | $312,400 | $117,900 | $194,500 |
| 2014 | $3,670 | $291,700 | $117,900 | $173,800 |
Source: Public Records
Map
Nearby Homes
- 4873 Washington St Unit 2
- 35 Heron St
- 15 Starling St
- 12 Eagle St
- 87 Searle Rd
- 4959 Washington St
- 10 Starling St
- 4975 Washington St Unit 311
- 4975 Washington St Unit 305
- 2 Lagrange St Unit 4
- 2 Lagrange St Unit 7
- 12 Loyola Cir
- 45 Weymouth Ave
- 231 Lagrange St
- 132 Woodley Ave
- 15 White Oak Rd
- 2290 Centre St
- 111 Grove St Unit 11
- 2231 Centre St
- 141 Bellevue St
- 49 Alleyne St
- 49 Alleyne St Unit 1
- 49 Allyeyne
- 49 Alleneye St
- 49 Alleneye St Unit 1
- 67 Alleyne St
- 41 Vershire St Unit R
- 41 Vershire St Unit L
- 41 Vershire St Unit 41R
- 41 Vershire St Unit Left
- 41 Alleyne St
- 44 Alleyne St
- 21 Maplewood St Unit 23
- 21 Maplewood St
- 21 Maplewood St Unit 21
- 21 Maplewood St Unit 2
- 21 Maplewood St Unit 1
- 21 Maplewood St Unit 3
- 52 Vershire St
- 50 Vershire St