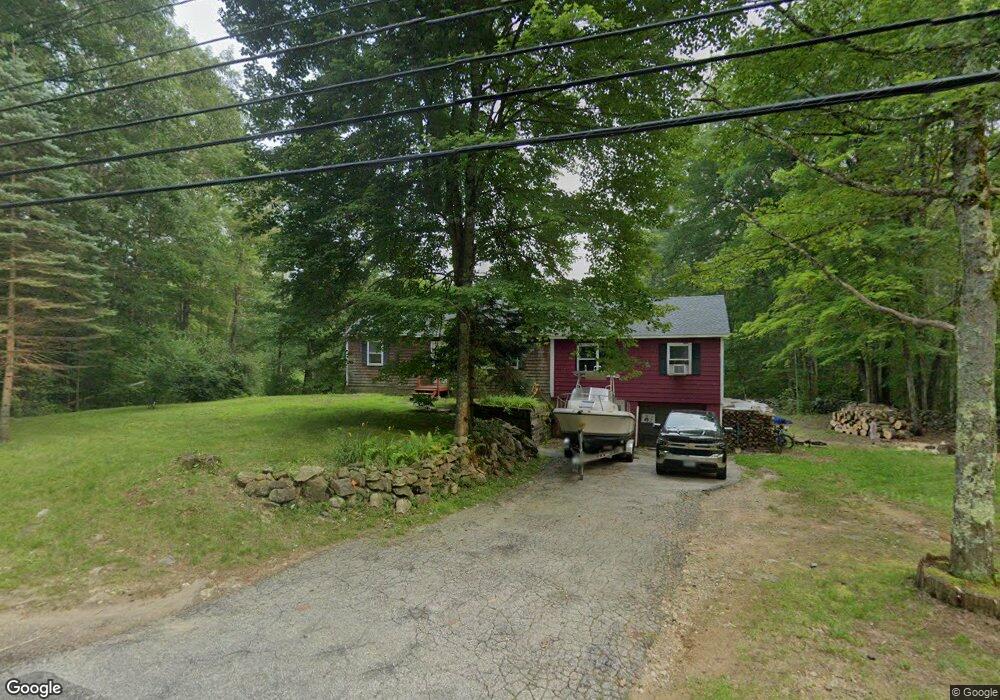
49 Baptist Rd Canterbury, NH 03224
Estimated Value: $468,000 - $511,000
3
Beds
1
Bath
1,759
Sq Ft
$275/Sq Ft
Est. Value
About This Home
This home is located at 49 Baptist Rd, Canterbury, NH 03224 and is currently estimated at $484,132, approximately $275 per square foot. 49 Baptist Rd is a home located in Merrimack County with nearby schools including Canterbury Elementary School, Belmont Middle School, and Belmont High School.
Ownership History
Date
Name
Owned For
Owner Type
Purchase Details
Closed on
Jan 26, 2021
Sold by
Piroso Kali and Piroso Michael
Bought by
Piroso Michael P
Current Estimated Value
Purchase Details
Closed on
Mar 19, 2018
Sold by
Piroso Starlene M Est
Bought by
Piroso Kali A and Piroso Michael P
Create a Home Valuation Report for This Property
The Home Valuation Report is an in-depth analysis detailing your home's value as well as a comparison with similar homes in the area
Home Values in the Area
Average Home Value in this Area
Purchase History
| Date | Buyer | Sale Price | Title Company |
|---|---|---|---|
| Piroso Michael P | -- | None Available | |
| Piroso Kali A | -- | -- |
Source: Public Records
Tax History Compared to Growth
Tax History
| Year | Tax Paid | Tax Assessment Tax Assessment Total Assessment is a certain percentage of the fair market value that is determined by local assessors to be the total taxable value of land and additions on the property. | Land | Improvement |
|---|---|---|---|---|
| 2024 | $6,253 | $275,700 | $128,700 | $147,000 |
| 2023 | $5,790 | $275,700 | $128,700 | $147,000 |
| 2022 | $5,735 | $275,700 | $128,700 | $147,000 |
| 2021 | $5,655 | $275,700 | $128,700 | $147,000 |
| 2020 | $5,645 | $204,600 | $88,400 | $116,200 |
| 2019 | $5,702 | $204,600 | $88,400 | $116,200 |
| 2018 | $5,436 | $204,600 | $88,400 | $116,200 |
| 2017 | $5,316 | $204,600 | $88,400 | $116,200 |
| 2016 | $5,105 | $204,600 | $88,400 | $116,200 |
| 2015 | $5,408 | $203,600 | $95,100 | $108,500 |
| 2014 | $5,507 | $203,600 | $95,100 | $108,500 |
| 2013 | $5,322 | $203,600 | $95,100 | $108,500 |
Source: Public Records
Map
Nearby Homes
- 26 Welch Rd
- 57 Center Rd
- 000 Baptist Rd Unit 1
- 309 Southwest Rd
- 22 Abberton Rd
- 527 Northwest Rd
- 557 Mountain Rd
- 22 Shelburne Ln
- 22 Shelburne Ln
- 287 Clough Pond Rd
- 306 Baptist Hill Rd
- 540 Mountain Rd
- 143 Shaker Rd
- 203 Old Shaker Rd
- 427 Shaker Rd
- 6 Old Boyce Rd
- 55 Whitehouse Rd
- 187 King St
- 5A Red Oak Way Unit 5A
- 3B Red Oak Way