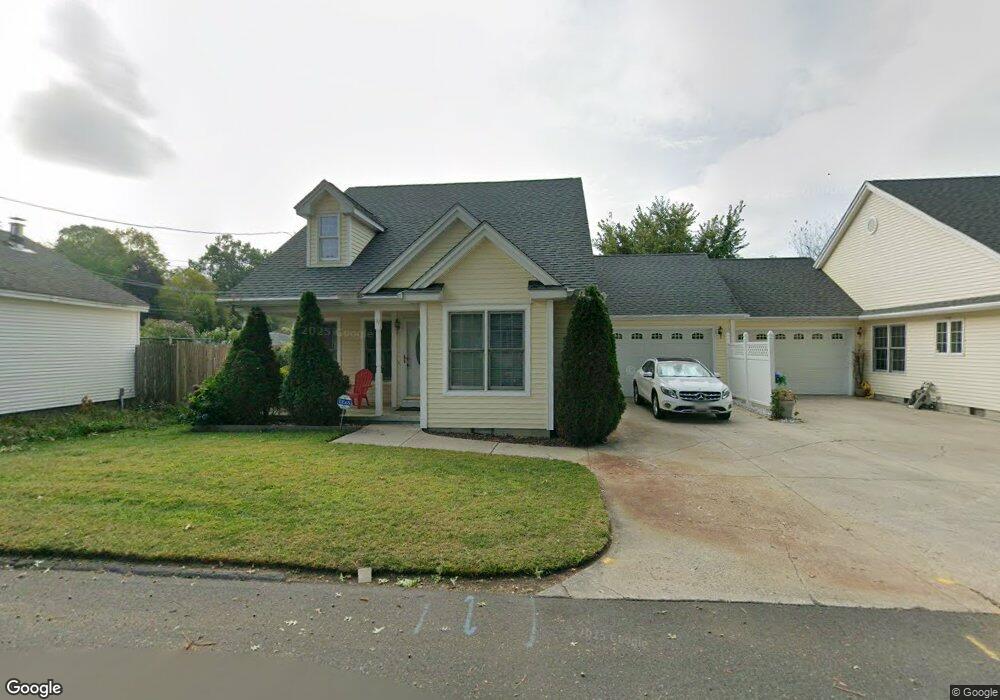
49 Bolton St Unit One South Hadley, MA 01075
Estimated Value: $325,000 - $364,000
3
Beds
2
Baths
1,265
Sq Ft
$269/Sq Ft
Est. Value
About This Home
This home is located at 49 Bolton St Unit One, South Hadley, MA 01075 and is currently estimated at $340,565, approximately $269 per square foot. 49 Bolton St Unit One is a home located in Hampshire County with nearby schools including Plains Elementary School, Mosier Elementary School, and Michael E. Smith Middle School.
Ownership History
Date
Name
Owned For
Owner Type
Purchase Details
Closed on
Apr 22, 2024
Sold by
Stoughton Sandra
Bought by
Henson John D and Hernandez Liza
Current Estimated Value
Home Financials for this Owner
Home Financials are based on the most recent Mortgage that was taken out on this home.
Original Mortgage
$262,400
Outstanding Balance
$258,479
Interest Rate
6.88%
Mortgage Type
Purchase Money Mortgage
Estimated Equity
$82,086
Purchase Details
Closed on
Jan 28, 2011
Sold by
Flemma John S
Bought by
Stoughton Sandra
Home Financials for this Owner
Home Financials are based on the most recent Mortgage that was taken out on this home.
Original Mortgage
$152,000
Interest Rate
4.83%
Mortgage Type
Purchase Money Mortgage
Create a Home Valuation Report for This Property
The Home Valuation Report is an in-depth analysis detailing your home's value as well as a comparison with similar homes in the area
Home Values in the Area
Average Home Value in this Area
Purchase History
| Date | Buyer | Sale Price | Title Company |
|---|---|---|---|
| Henson John D | $328,000 | None Available | |
| Henson John D | $328,000 | None Available | |
| Stoughton Sandra | $160,000 | -- | |
| Stoughton Sandra | $160,000 | -- |
Source: Public Records
Mortgage History
| Date | Status | Borrower | Loan Amount |
|---|---|---|---|
| Open | Henson John D | $262,400 | |
| Closed | Henson John D | $262,400 | |
| Previous Owner | Stoughton Sandra | $150,000 | |
| Previous Owner | Stoughton Sandra | $152,000 |
Source: Public Records
Tax History Compared to Growth
Tax History
| Year | Tax Paid | Tax Assessment Tax Assessment Total Assessment is a certain percentage of the fair market value that is determined by local assessors to be the total taxable value of land and additions on the property. | Land | Improvement |
|---|---|---|---|---|
| 2025 | $3,968 | $249,100 | $0 | $249,100 |
| 2024 | $3,771 | $226,500 | $0 | $226,500 |
| 2023 | $3,601 | $205,200 | $0 | $205,200 |
| 2022 | $3,498 | $189,300 | $0 | $189,300 |
| 2021 | $3,441 | $176,800 | $0 | $176,800 |
| 2020 | $3,368 | $168,900 | $0 | $168,900 |
| 2019 | $3,184 | $158,000 | $0 | $158,000 |
| 2018 | $3,149 | $158,000 | $0 | $158,000 |
| 2017 | $3,179 | $158,000 | $0 | $158,000 |
| 2016 | $3,035 | $152,900 | $0 | $152,900 |
| 2015 | $2,878 | $148,500 | $0 | $148,500 |
Source: Public Records
Map
Nearby Homes
- 32 North St
- 3 Ralph Ave
- 27 Bardwell St Unit 4
- 49 N Main St
- 48 N Canal St
- 55 Dowds Ln
- 45 Shadow Brook Estate
- 64 Dowds Ln
- 133 Granby Rd
- 7 Hunter Terrace
- 63-65 Mosher St
- 2 Arbor Way Unit C
- 70 Lathrop St
- 246 E Dwight St
- 318 Newton St
- 592 Prospect St
- 73 Yorktown Ct
- 75 Elm St
- 0 Granby Rd
- 41 W Summit St Unit 72