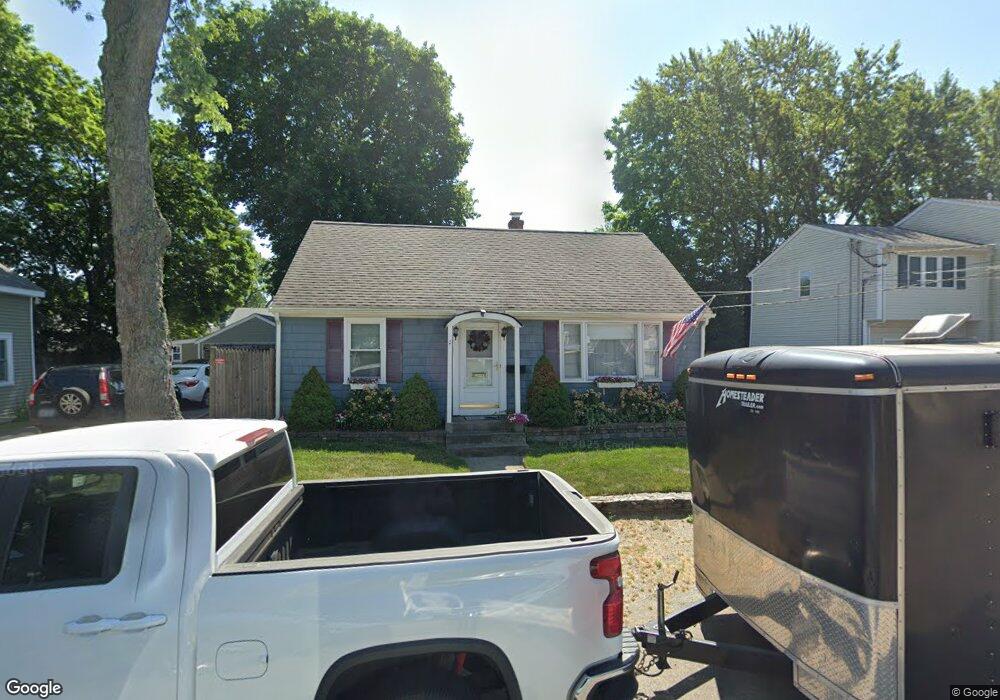
49 Bowen St Pawtucket, RI 02861
Darlington NeighborhoodEstimated Value: $337,000 - $404,000
4
Beds
1
Bath
1,958
Sq Ft
$190/Sq Ft
Est. Value
About This Home
This home is located at 49 Bowen St, Pawtucket, RI 02861 and is currently estimated at $371,837, approximately $189 per square foot. 49 Bowen St is a home located in Providence County with nearby schools including St Cecilia School and Dayspring Christian Academy.
Ownership History
Date
Name
Owned For
Owner Type
Purchase Details
Closed on
Nov 7, 2025
Sold by
Hale Kevin
Bought by
Hale Kevin J and Hale Pauletta M
Current Estimated Value
Purchase Details
Closed on
Jul 18, 2016
Sold by
Hale Steven
Bought by
Hale Steven
Purchase Details
Closed on
May 26, 2010
Sold by
Hale Steven and Hale Kevin
Bought by
Sherri Rlty
Purchase Details
Closed on
Nov 20, 2007
Sold by
Fitton David E and Fitton Sandra
Bought by
Hale Steven and Hale Kevin
Create a Home Valuation Report for This Property
The Home Valuation Report is an in-depth analysis detailing your home's value as well as a comparison with similar homes in the area
Home Values in the Area
Average Home Value in this Area
Purchase History
| Date | Buyer | Sale Price | Title Company |
|---|---|---|---|
| Hale Kevin J | -- | -- | |
| Hale Steven | -- | -- | |
| Sherri Rlty | $4,971 | -- | |
| Hale Steven | $130,000 | -- |
Source: Public Records
Tax History
| Year | Tax Paid | Tax Assessment Tax Assessment Total Assessment is a certain percentage of the fair market value that is determined by local assessors to be the total taxable value of land and additions on the property. | Land | Improvement |
|---|---|---|---|---|
| 2025 | $4,094 | $311,300 | $152,400 | $158,900 |
| 2024 | $3,841 | $311,300 | $152,400 | $158,900 |
| 2023 | $3,459 | $204,200 | $69,700 | $134,500 |
| 2022 | $3,386 | $204,200 | $69,700 | $134,500 |
| 2021 | $3,386 | $204,200 | $69,700 | $134,500 |
| 2020 | $3,472 | $166,200 | $63,100 | $103,100 |
| 2019 | $3,472 | $166,200 | $63,100 | $103,100 |
| 2018 | $3,346 | $166,200 | $63,100 | $103,100 |
| 2017 | $3,131 | $137,800 | $48,400 | $89,400 |
| 2016 | $3,016 | $137,800 | $48,400 | $89,400 |
| 2015 | $3,016 | $137,800 | $48,400 | $89,400 |
| 2014 | $2,929 | $127,000 | $48,400 | $78,600 |
Source: Public Records
Map
Nearby Homes
Your Personal Tour Guide
Ask me questions while you tour the home.