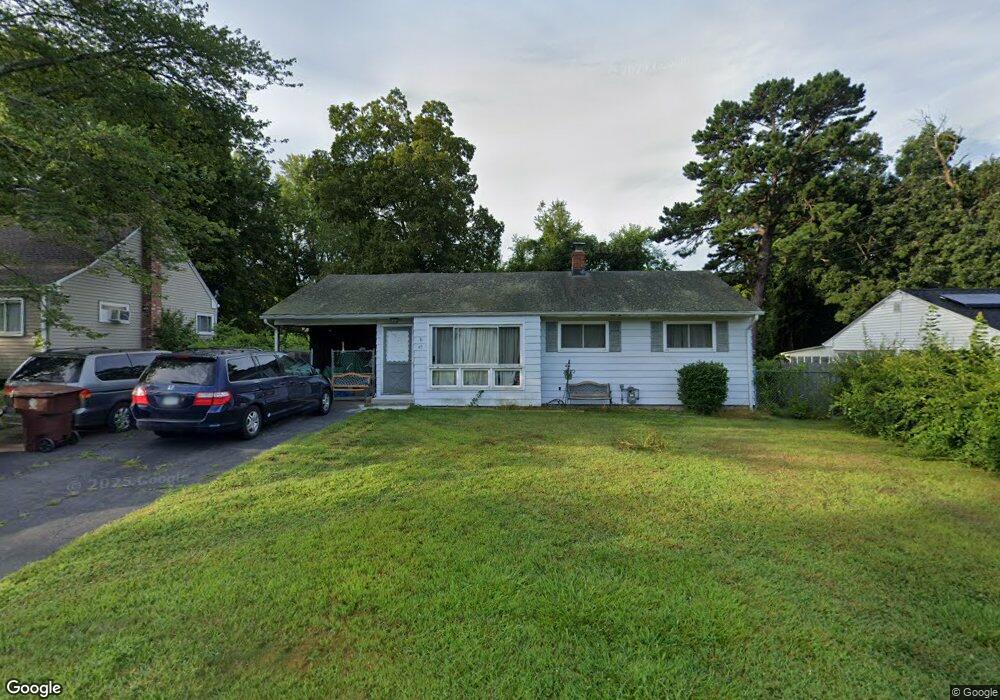
49 Broadleaf Ln Enfield, CT 06082
Estimated Value: $275,956 - $297,000
3
Beds
1
Bath
976
Sq Ft
$294/Sq Ft
Est. Value
About This Home
This home is located at 49 Broadleaf Ln, Enfield, CT 06082 and is currently estimated at $286,989, approximately $294 per square foot. 49 Broadleaf Ln is a home located in Hartford County with nearby schools including Enfield Street Elementary School, Edgar H. Parkman School, and Enfield High School.
Ownership History
Date
Name
Owned For
Owner Type
Purchase Details
Closed on
Mar 7, 2011
Sold by
Hsbc Mortgage Svcs
Bought by
Hassan Mahmood and Chaudhry Rabia
Current Estimated Value
Home Financials for this Owner
Home Financials are based on the most recent Mortgage that was taken out on this home.
Original Mortgage
$131,577
Outstanding Balance
$90,746
Interest Rate
4.87%
Mortgage Type
FHA
Estimated Equity
$196,243
Purchase Details
Closed on
Oct 29, 2010
Sold by
Justice Kimberly
Bought by
Hsbc Mortgage
Purchase Details
Closed on
Jun 28, 2000
Sold by
Travali Stephen and Travali Patricia
Bought by
Justice Marc and Justice Kimberly
Purchase Details
Closed on
Mar 15, 2000
Sold by
Ocwen Federal Bk
Bought by
Travali Stephen and Trvali Patricia
Purchase Details
Closed on
Oct 29, 1992
Sold by
Morgan Helen Est
Bought by
Milvae Noreen
Create a Home Valuation Report for This Property
The Home Valuation Report is an in-depth analysis detailing your home's value as well as a comparison with similar homes in the area
Home Values in the Area
Average Home Value in this Area
Purchase History
| Date | Buyer | Sale Price | Title Company |
|---|---|---|---|
| Hassan Mahmood | $135,000 | -- | |
| Hsbc Mortgage | -- | -- | |
| Justice Marc | $108,000 | -- | |
| Travali Stephen | $65,000 | -- | |
| Milvae Noreen | $112,000 | -- |
Source: Public Records
Mortgage History
| Date | Status | Borrower | Loan Amount |
|---|---|---|---|
| Open | Milvae Noreen | $131,577 | |
| Previous Owner | Milvae Noreen | $15,779 | |
| Previous Owner | Milvae Noreen | $179,000 |
Source: Public Records
Tax History
| Year | Tax Paid | Tax Assessment Tax Assessment Total Assessment is a certain percentage of the fair market value that is determined by local assessors to be the total taxable value of land and additions on the property. | Land | Improvement |
|---|---|---|---|---|
| 2025 | $3,996 | $114,200 | $49,700 | $64,500 |
| 2024 | $3,889 | $114,200 | $49,700 | $64,500 |
| 2023 | $3,860 | $114,200 | $49,700 | $64,500 |
| 2022 | $3,505 | $114,200 | $49,700 | $64,500 |
| 2021 | $3,252 | $86,640 | $39,220 | $47,420 |
| 2020 | $3,252 | $86,640 | $39,220 | $47,420 |
| 2019 | $3,260 | $86,640 | $39,220 | $47,420 |
| 2018 | $3,206 | $86,640 | $39,220 | $47,420 |
| 2017 | $3,026 | $86,640 | $39,220 | $47,420 |
| 2016 | $3,218 | $93,780 | $43,930 | $49,850 |
| 2015 | $1,771 | $93,780 | $43,930 | $49,850 |
| 2014 | $3,037 | $93,780 | $43,930 | $49,850 |
Source: Public Records
Map
Nearby Homes
- 2 Pearl Street Extension
- 5 the Hamlet Unit D
- 1.5 Bridge Ln
- 1527 King St
- 315 East St S
- 92 Post Office Rd
- 1561 King St
- 270 Pearl St
- 3 Riverdale Rd
- 1165 Enfield St Unit 11
- 242 Pearl St
- 779 Bridge St
- 22 Pheasant Hill Dr
- 660 East St S
- 51 Barrett Rd
- 687 East St S
- 29 Silver Ln
- 19 Copper Dr
- 713 Thrall Ave
- 38 Vernon Rd
- 51 Broadleaf Ln
- 47 Broadleaf Ln
- 46 Broadleaf Ln
- 50 Broadleaf Ln
- 48 Broadleaf Ln
- 45 Broadleaf Ln
- 53 Broadleaf Ln
- 44 Broadleaf Ln
- 52 Broadleaf Ln
- 55 Broadleaf Ln
- 42 Broadleaf Ln
- 43 Broadleaf Ln
- 41 Meadowlark Rd
- 35 Meadowlark Rd
- 39 Meadowlark Rd
- 54 Broadleaf Ln
- 37 Meadowlark Rd
- 40 Broadleaf Ln
- 41 Broadleaf Ln
- 57 Broadleaf Ln
Your Personal Tour Guide
Ask me questions while you tour the home.