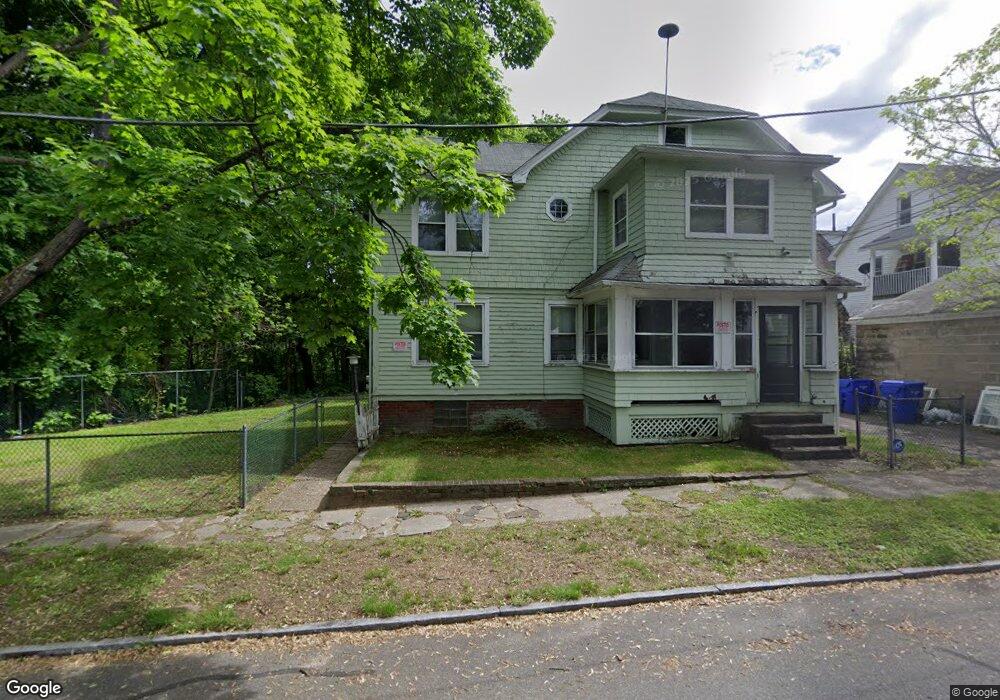
49 Byron St Springfield, MA 01109
Upper Hill NeighborhoodEstimated Value: $281,000 - $360,000
4
Beds
2
Baths
2,344
Sq Ft
$137/Sq Ft
Est. Value
About This Home
This home is located at 49 Byron St, Springfield, MA 01109 and is currently estimated at $321,426, approximately $137 per square foot. 49 Byron St is a home located in Hampden County with nearby schools including Homer Street Elementary School, John J Duggan Middle, and Springfield High School of Science and Technology.
Ownership History
Date
Name
Owned For
Owner Type
Purchase Details
Closed on
Sep 30, 1993
Sold by
Kinanis Anastasios and Kinanis Demetra
Bought by
Johnson Lavone
Current Estimated Value
Home Financials for this Owner
Home Financials are based on the most recent Mortgage that was taken out on this home.
Original Mortgage
$68,400
Interest Rate
7%
Mortgage Type
Purchase Money Mortgage
Create a Home Valuation Report for This Property
The Home Valuation Report is an in-depth analysis detailing your home's value as well as a comparison with similar homes in the area
Home Values in the Area
Average Home Value in this Area
Purchase History
| Date | Buyer | Sale Price | Title Company |
|---|---|---|---|
| Johnson Lavone | $72,000 | -- | |
| Johnson Lavone | $72,000 | -- |
Source: Public Records
Mortgage History
| Date | Status | Borrower | Loan Amount |
|---|---|---|---|
| Closed | Johnson Lavone | $68,400 | |
| Previous Owner | Johnson Lavone | $4,582 |
Source: Public Records
Tax History
| Year | Tax Paid | Tax Assessment Tax Assessment Total Assessment is a certain percentage of the fair market value that is determined by local assessors to be the total taxable value of land and additions on the property. | Land | Improvement |
|---|---|---|---|---|
| 2025 | $3,033 | $193,400 | $29,500 | $163,900 |
| 2024 | $2,857 | $177,900 | $29,500 | $148,400 |
| 2023 | $2,237 | $131,200 | $26,800 | $104,400 |
| 2022 | $2,053 | $109,100 | $25,000 | $84,100 |
| 2021 | $2,177 | $115,200 | $17,800 | $97,400 |
| 2020 | $2,088 | $106,900 | $17,800 | $89,100 |
| 2019 | $1,938 | $98,500 | $15,200 | $83,300 |
| 2018 | $1,816 | $92,300 | $15,200 | $77,100 |
| 2017 | $1,663 | $84,600 | $14,200 | $70,400 |
| 2016 | $1,345 | $68,400 | $14,200 | $54,200 |
| 2015 | $1,340 | $68,100 | $14,200 | $53,900 |
Source: Public Records
Map
Nearby Homes
- 111 Marlborough St
- 89 Bristol St
- 31-33 Suffolk St
- 87 Fenwick St
- 46-48 Suffolk St
- 11 Ina St
- 135-137 Suffolk St
- 283 Wilbraham Rd
- 48-50 Dresden St
- 34 Elsie St
- 124-126 Westford Cir
- 21 Westford Cir
- 0 NS (24) Alden St
- 236 Pondview Dr
- 750 Wilbraham Rd
- 15 Kenyon St
- 65 Montrose St
- 189 Northampton Ave
- 145 Cambridge St
- 52-56 Andrew St
- 61 Carlisle St
- 59 Carlisle St
- 40 Byron St
- 49 Carlisle St
- 45 Carlisle St
- 73 Carlisle St
- 32 Byron St
- 39 Carlisle St
- 58 Carlisle St
- 64 Carlisle St
- 54 Carlisle St
- 48 Carlisle St
- 26 Byron St
- 74 Carlisle St
- 33 Carlisle St Unit 35
- 44 Carlisle St
- 128 Marlborough St
- 22 Byron St
- 38 Carlisle St Unit 40
- 38-40 Carlisle St
Your Personal Tour Guide
Ask me questions while you tour the home.