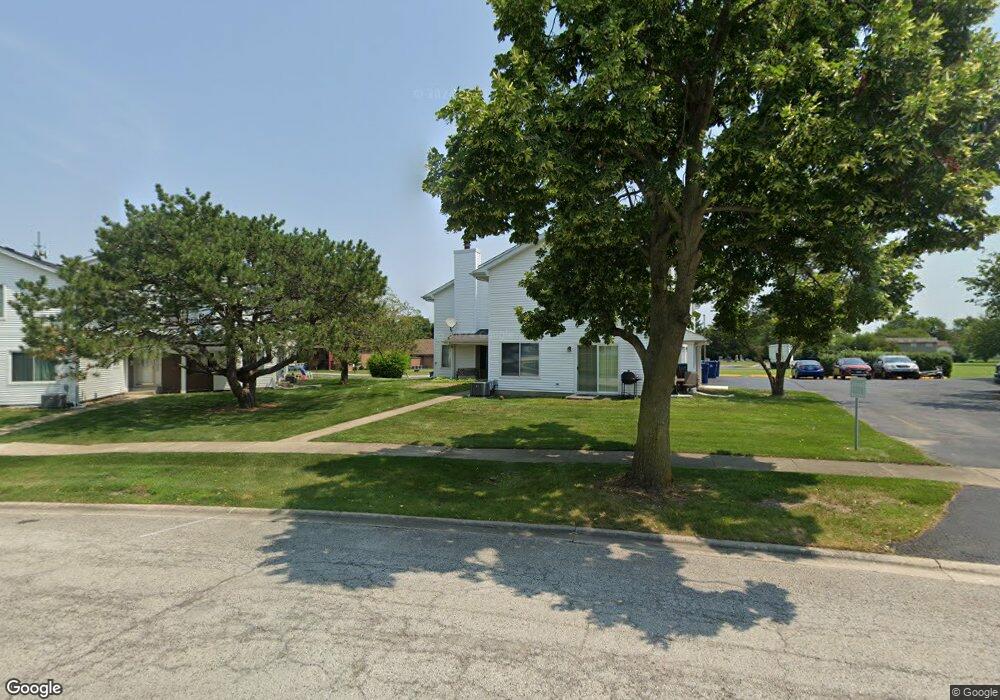
49 Churn Rd Unit 27 Matteson, IL 60443
West Matteson NeighborhoodEstimated Value: $123,955 - $146,000
Studio
--
Bath
50,062
Sq Ft
$3/Sq Ft
Est. Value
About This Home
This home is located at 49 Churn Rd Unit 27, Matteson, IL 60443 and is currently estimated at $134,739, approximately $2 per square foot. 49 Churn Rd Unit 27 is a home located in Cook County with nearby schools including Colin Powell Middle School and Dr. Wolfe's Montessori School.
Ownership History
Date
Name
Owned For
Owner Type
Purchase Details
Closed on
Oct 6, 2004
Sold by
Robinson James R
Bought by
Stallworth Benjamin
Current Estimated Value
Home Financials for this Owner
Home Financials are based on the most recent Mortgage that was taken out on this home.
Original Mortgage
$81,600
Outstanding Balance
$40,178
Interest Rate
6%
Mortgage Type
Unknown
Estimated Equity
$94,561
Purchase Details
Closed on
Jan 16, 2002
Sold by
The Chicago Transit Authority
Bought by
The City Of Chicago
Purchase Details
Closed on
Nov 10, 1998
Sold by
Molsen Jeffrey A
Bought by
Robinson James R
Home Financials for this Owner
Home Financials are based on the most recent Mortgage that was taken out on this home.
Original Mortgage
$85,400
Interest Rate
6.68%
Create a Home Valuation Report for This Property
The Home Valuation Report is an in-depth analysis detailing your home's value as well as a comparison with similar homes in the area
Home Values in the Area
Average Home Value in this Area
Purchase History
| Date | Buyer | Sale Price | Title Company |
|---|---|---|---|
| Stallworth Benjamin | $102,000 | Cti | |
| The City Of Chicago | -- | Chicago Title Insurance Co | |
| Robinson James R | $90,000 | -- |
Source: Public Records
Mortgage History
| Date | Status | Borrower | Loan Amount |
|---|---|---|---|
| Open | Stallworth Benjamin | $81,600 | |
| Previous Owner | Robinson James R | $85,400 | |
| Closed | Stallworth Benjamin | $20,400 |
Source: Public Records
Tax History
| Year | Tax Paid | Tax Assessment Tax Assessment Total Assessment is a certain percentage of the fair market value that is determined by local assessors to be the total taxable value of land and additions on the property. | Land | Improvement |
|---|---|---|---|---|
| 2025 | $3,002 | $10,559 | $2,453 | $8,106 |
| 2024 | $3,002 | $10,559 | $2,453 | $8,106 |
| 2023 | $1,782 | $10,559 | $2,453 | $8,106 |
| 2022 | $1,782 | $6,750 | $2,007 | $4,743 |
| 2021 | $1,847 | $6,748 | $2,006 | $4,742 |
| 2020 | $1,904 | $6,748 | $2,006 | $4,742 |
| 2019 | $3,931 | $10,624 | $1,783 | $8,841 |
| 2018 | $3,871 | $10,624 | $1,783 | $8,841 |
| 2017 | $3,795 | $10,624 | $1,783 | $8,841 |
| 2016 | $3,180 | $8,642 | $1,672 | $6,970 |
| 2015 | $3,058 | $8,642 | $1,672 | $6,970 |
| 2014 | $3,002 | $8,642 | $1,672 | $6,970 |
| 2013 | $2,708 | $8,515 | $1,672 | $6,843 |
Source: Public Records
Map
Nearby Homes
- 34 Wedgewood Rd
- 6128 Wedgewood Ct
- 72 White Oaks Rd
- 6237 Michael Ln
- 10 Wedgewood Rd
- 41 Willow Rd
- 6005 Woodgate Dr
- 42 Pheasant Rd
- 5943 Woodgate Dr
- 124 Oriole Rd
- 25 Pheasant Rd
- 5911 Timberlane Rd
- 123 Oriole Rd
- 13 Oakview Rd
- 152 Oakhurst Rd
- 443 Danielle Rd
- 40 Huntingwood Rd
- 133 Deerpath Rd
- 5742 Woodgate Dr
- 156 Cloverleaf Rd
- 51 Churn Rd Unit 37
- 53 Churn Rd Unit 47
- 47 Churn Rd Unit 26
- 47 Churn Rd Unit 5-6
- 45 Churn Rd Unit 36
- 43 Churn Rd Unit 46
- 63 Churn Rd Unit 28
- 61 Churn Rd Unit 38
- 55 Churn Rd Unit 17
- 59 Churn Rd Unit 48
- 57 Churn Rd Unit 18
- 41 Churn Rd Unit 16
- 35 Churn Rd Unit 35
- 39 Churn Rd Unit 15
- 37 Churn Rd Unit 45
- 33 Churn Rd Unit 25
- 33 Churn Rd Unit 33
- 33 Churn Rd Unit 1
- 42 Churn Rd Unit 312
- 40 Churn Rd Unit 212
Your Personal Tour Guide
Ask me questions while you tour the home.