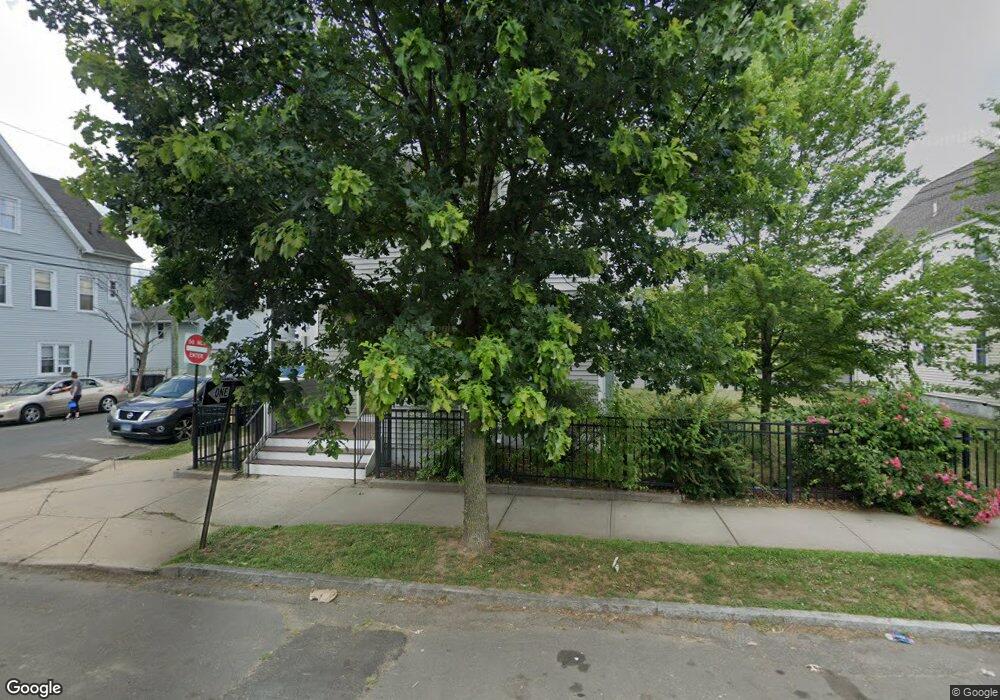
49 Clay St New Haven, CT 06513
Fair Haven NeighborhoodEstimated Value: $266,335 - $364,000
4
Beds
2
Baths
1,936
Sq Ft
$167/Sq Ft
Est. Value
About This Home
This home is located at 49 Clay St, New Haven, CT 06513 and is currently estimated at $324,084, approximately $167 per square foot. 49 Clay St is a home located in New Haven County with nearby schools including Clinton Avenue School, Elm City College Preparatory School, and St Francis & St Rose Of Lima School.
Ownership History
Date
Name
Owned For
Owner Type
Purchase Details
Closed on
Oct 31, 2011
Sold by
Mutual Hsng Assn S Cen
Bought by
Fair Haven Mutual Hsng
Current Estimated Value
Purchase Details
Closed on
May 8, 2007
Sold by
Guardian Investments L
Bought by
Mutual Housing Assoc C
Home Financials for this Owner
Home Financials are based on the most recent Mortgage that was taken out on this home.
Original Mortgage
$210,000
Interest Rate
2%
Purchase Details
Closed on
Aug 5, 2005
Sold by
Pettola Peter
Bought by
Rodriguez Manuel
Purchase Details
Closed on
Sep 26, 2000
Sold by
New Haven Sb
Bought by
Pettola Peter
Create a Home Valuation Report for This Property
The Home Valuation Report is an in-depth analysis detailing your home's value as well as a comparison with similar homes in the area
Home Values in the Area
Average Home Value in this Area
Purchase History
| Date | Buyer | Sale Price | Title Company |
|---|---|---|---|
| Fair Haven Mutual Hsng | -- | -- | |
| Fair Haven Mutual Hsng | -- | -- | |
| Mutual Housing Assoc C | $215,000 | -- | |
| Guardian Investments L | $101,000 | -- | |
| Rodriguez Manuel | $177,000 | -- | |
| Pettola Peter | $39,000 | -- |
Source: Public Records
Mortgage History
| Date | Status | Borrower | Loan Amount |
|---|---|---|---|
| Previous Owner | Pettola Peter | $136,000 | |
| Previous Owner | Pettola Peter | $1,500,000 | |
| Previous Owner | Pettola Peter | $210,000 |
Source: Public Records
Tax History Compared to Growth
Tax History
| Year | Tax Paid | Tax Assessment Tax Assessment Total Assessment is a certain percentage of the fair market value that is determined by local assessors to be the total taxable value of land and additions on the property. | Land | Improvement |
|---|---|---|---|---|
| 2025 | $4,576 | $116,130 | $26,320 | $89,810 |
| 2024 | $4,471 | $116,130 | $26,320 | $89,810 |
| 2023 | $7,054 | $189,630 | $26,320 | $163,310 |
| 2022 | $7,538 | $189,630 | $26,320 | $163,310 |
| 2021 | $1,773 | $40,408 | $21,070 | $19,338 |
| 2020 | $1,773 | $40,408 | $21,070 | $19,338 |
| 2019 | $1,737 | $40,408 | $21,070 | $19,338 |
| 2018 | $1,737 | $40,408 | $21,070 | $19,338 |
| 2017 | $4,018 | $103,880 | $21,070 | $82,810 |
| 2016 | $1,378 | $33,176 | $14,070 | $19,106 |
| 2015 | $1,378 | $33,176 | $14,070 | $19,106 |
| 2014 | $3,496 | $84,140 | $14,070 | $70,070 |
Source: Public Records
Map
Nearby Homes