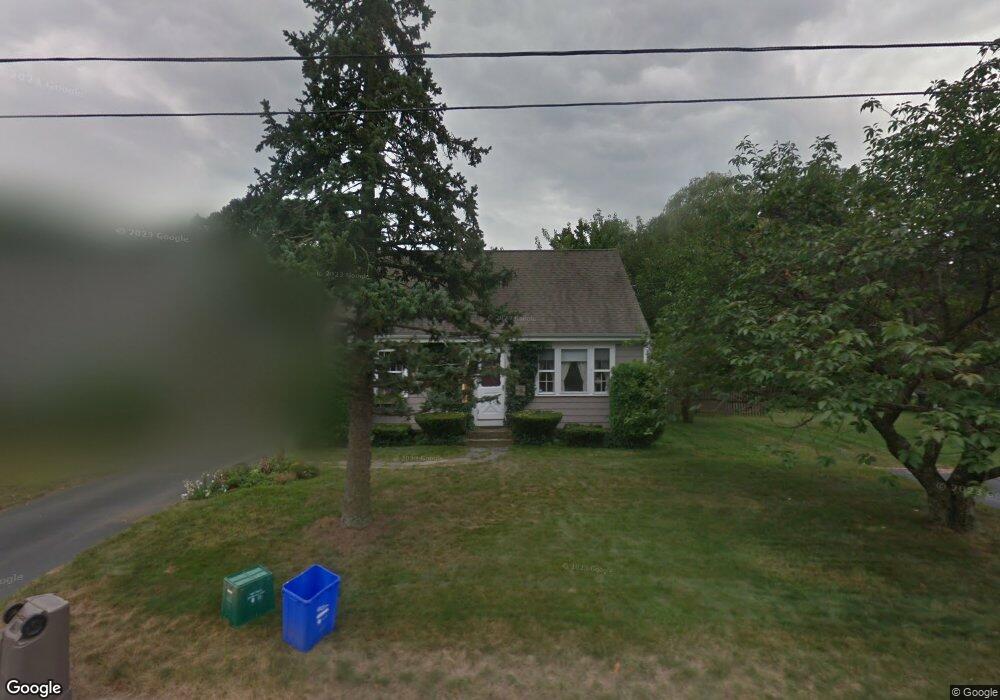
49 Cove St Riverside, RI 02915
Riverside NeighborhoodEstimated Value: $399,000 - $445,000
3
Beds
2
Baths
1,040
Sq Ft
$402/Sq Ft
Est. Value
About This Home
This home is located at 49 Cove St, Riverside, RI 02915 and is currently estimated at $418,150, approximately $402 per square foot. 49 Cove St is a home located in Providence County with nearby schools including East Providence High School, St Luke Elementary School, and St Mary Academy-Bay View.
Ownership History
Date
Name
Owned For
Owner Type
Purchase Details
Closed on
Jun 30, 2014
Sold by
Loiselle Ernest A and Loiselle Priscilla M
Bought by
Loiselle Eric and Loiselle Ryan
Current Estimated Value
Purchase Details
Closed on
Jun 2, 1983
Bought by
Loiselle Eric and Loiselle Ryan
Create a Home Valuation Report for This Property
The Home Valuation Report is an in-depth analysis detailing your home's value as well as a comparison with similar homes in the area
Home Values in the Area
Average Home Value in this Area
Purchase History
| Date | Buyer | Sale Price | Title Company |
|---|---|---|---|
| Loiselle Eric | -- | -- | |
| Loiselle Eric | -- | -- | |
| Loiselle Eric | $40,000 | -- | |
| Loiselle Eric | -- | -- |
Source: Public Records
Mortgage History
| Date | Status | Borrower | Loan Amount |
|---|---|---|---|
| Open | Loiselle Eric | $128,800 | |
| Previous Owner | Loiselle Eric | $50,000 |
Source: Public Records
Tax History
| Year | Tax Paid | Tax Assessment Tax Assessment Total Assessment is a certain percentage of the fair market value that is determined by local assessors to be the total taxable value of land and additions on the property. | Land | Improvement |
|---|---|---|---|---|
| 2025 | $4,739 | $362,600 | $114,200 | $248,400 |
| 2024 | $4,717 | $307,700 | $95,100 | $212,600 |
| 2023 | $4,542 | $307,700 | $95,100 | $212,600 |
| 2022 | $4,593 | $210,100 | $63,100 | $147,000 |
| 2021 | $4,517 | $210,100 | $61,800 | $148,300 |
| 2020 | $4,326 | $210,100 | $61,800 | $148,300 |
| 2019 | $4,206 | $210,100 | $61,800 | $148,300 |
| 2018 | $3,814 | $166,700 | $41,900 | $124,800 |
| 2017 | $3,729 | $166,700 | $41,900 | $124,800 |
| 2016 | $3,711 | $166,700 | $41,900 | $124,800 |
| 2015 | $3,732 | $162,600 | $41,600 | $121,000 |
| 2014 | $3,732 | $162,600 | $41,600 | $121,000 |
Source: Public Records
Map
Nearby Homes
- 41 White Ave
- 15 Claire St
- 72 Stowe Ave
- 56 Knowlton St
- 0 Carousel Dr
- 14 Winthrop St
- 33 Pine St Unit 35
- 14 Benedict St
- 85 Hilton Ave
- 916 Bullocks Pt Ave
- 103 Burnside Ave
- 25 Winslow St
- 9 Mystic Ave
- 28 Jefferson Ave
- 25 Arnold St
- 15 Plaza Dr
- 151 Willett Ave Unit 2
- 23 Albert Ave
- 45 Washington Rd
- 43 Bullocks Point Ave Unit 4A
Your Personal Tour Guide
Ask me questions while you tour the home.