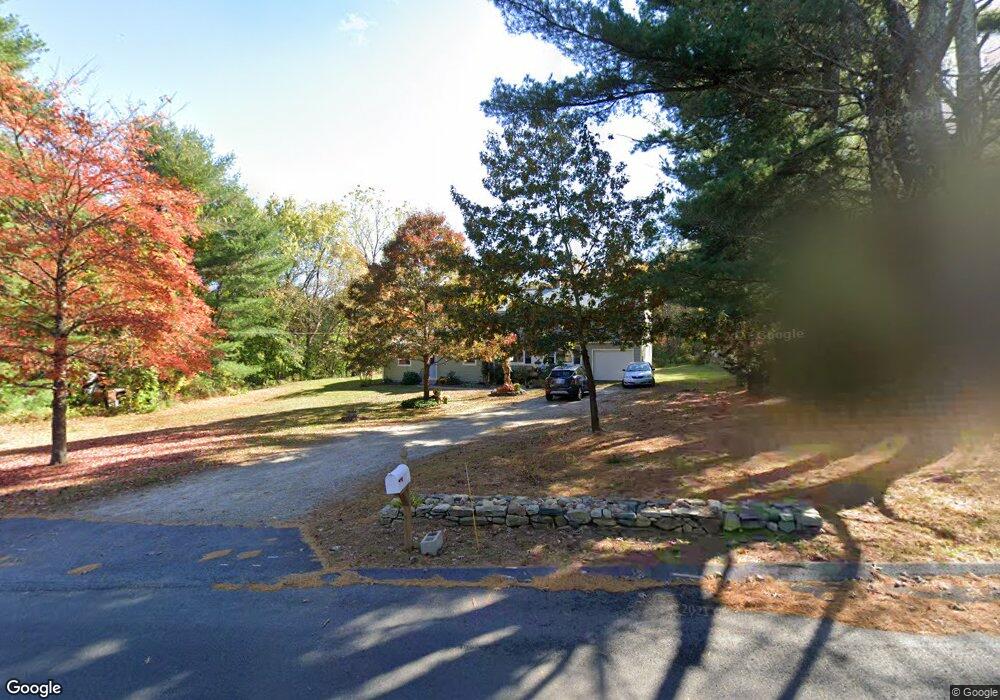
49 Cross St Bellingham, MA 02019
Estimated Value: $601,000 - $851,000
4
Beds
3
Baths
2,880
Sq Ft
$239/Sq Ft
Est. Value
About This Home
This home is located at 49 Cross St, Bellingham, MA 02019 and is currently estimated at $687,066, approximately $238 per square foot. 49 Cross St is a home located in Norfolk County with nearby schools including Joseph F. DiPietro Elementary, Bellingham High School, and Rise Prep Mayoral Academy Middle School.
Ownership History
Date
Name
Owned For
Owner Type
Purchase Details
Closed on
Sep 17, 2024
Sold by
St Gelais Robert R and St Gelais Donna M
Bought by
St Gelais Lt and St Gelais
Current Estimated Value
Purchase Details
Closed on
Dec 30, 1976
Bought by
Stgelais Robert and Stgelais Donna
Create a Home Valuation Report for This Property
The Home Valuation Report is an in-depth analysis detailing your home's value as well as a comparison with similar homes in the area
Home Values in the Area
Average Home Value in this Area
Purchase History
| Date | Buyer | Sale Price | Title Company |
|---|---|---|---|
| St Gelais Lt | -- | None Available | |
| St Gelais Lt | -- | None Available | |
| Stgelais Robert | $27,500 | -- |
Source: Public Records
Mortgage History
| Date | Status | Borrower | Loan Amount |
|---|---|---|---|
| Previous Owner | Stgelais Robert | $120,000 | |
| Previous Owner | Stgelais Robert | $50,000 |
Source: Public Records
Tax History Compared to Growth
Tax History
| Year | Tax Paid | Tax Assessment Tax Assessment Total Assessment is a certain percentage of the fair market value that is determined by local assessors to be the total taxable value of land and additions on the property. | Land | Improvement |
|---|---|---|---|---|
| 2025 | $5,671 | $451,500 | $175,100 | $276,400 |
| 2024 | $5,418 | $421,300 | $159,900 | $261,400 |
| 2023 | $5,223 | $400,200 | $152,300 | $247,900 |
| 2022 | $5,108 | $362,800 | $127,500 | $235,300 |
| 2021 | $4,950 | $343,500 | $127,500 | $216,000 |
| 2020 | $4,765 | $335,100 | $127,500 | $207,600 |
| 2019 | $4,675 | $329,000 | $127,500 | $201,500 |
| 2018 | $4,402 | $305,500 | $122,700 | $182,800 |
| 2017 | $4,312 | $300,700 | $122,700 | $178,000 |
| 2016 | $4,098 | $286,800 | $120,800 | $166,000 |
| 2015 | $3,930 | $275,800 | $116,200 | $159,600 |
| 2014 | $3,948 | $269,300 | $113,500 | $155,800 |
Source: Public Records
Map
Nearby Homes
- 1 Clover Dr
- 26 Iris Ln
- 17 Susan Ln
- 352 Lake St
- 19 Geordan Ave
- 46 Douglas Dr
- 211 S Main St
- 0 North St Unit 73440626
- 89 Lakeview Ave
- 975 S Main St
- 11 Silver Ave
- 0 Prospect St
- 6 Fleuette Dr
- 66 Newland Ave
- 8 Bubbling Brook Rd
- 125 Blackstone St
- 2 Duhamel Way
- 1250 Pulaski Blvd
- 501 Old Bridge Ln Unit 501
- 1099 S Main St