49 E 1st St Howell, NJ 07731
Adelphia NeighborhoodEstimated Value: $420,000 - $551,600
2
Beds
1
Bath
996
Sq Ft
$486/Sq Ft
Est. Value
About This Home
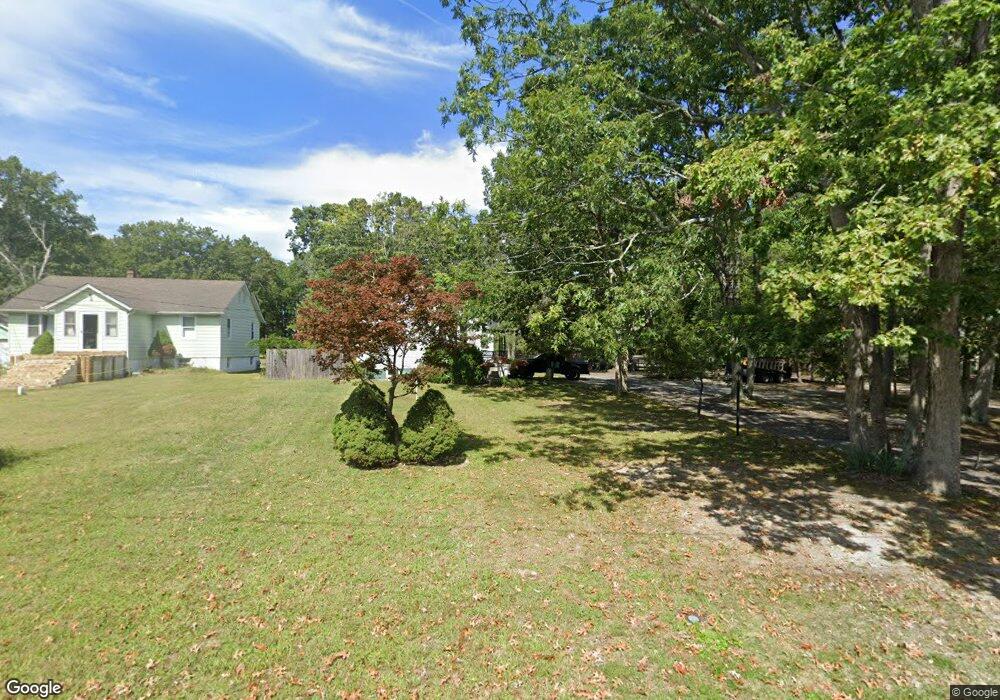
This home is located at 49 E 1st St, Howell, NJ 07731 and is currently estimated at $483,900, approximately $485 per square foot. 49 E 1st St is a home located in Monmouth County with nearby schools including Land O' Pines School, Newbury School, and Howell Middle School North.
Ownership History
Date
Name
Owned For
Owner Type
Purchase Details
Closed on
Jun 15, 2004
Sold by
Bloodgood Stacy
Bought by
Baine Michael and Baine Robin
Current Estimated Value
Home Financials for this Owner
Home Financials are based on the most recent Mortgage that was taken out on this home.
Original Mortgage
$320,000
Outstanding Balance
$159,566
Interest Rate
6.3%
Estimated Equity
$324,334
Purchase Details
Closed on
Sep 28, 2001
Sold by
Mcmahon William
Bought by
Bloodgood Stacy and Bloodgood Carla
Home Financials for this Owner
Home Financials are based on the most recent Mortgage that was taken out on this home.
Original Mortgage
$184,500
Interest Rate
6.91%
Purchase Details
Closed on
Mar 27, 1996
Sold by
Jelangin Victor
Bought by
Mcmahon William and King Meredith
Home Financials for this Owner
Home Financials are based on the most recent Mortgage that was taken out on this home.
Original Mortgage
$80,000
Interest Rate
7.31%
Create a Home Valuation Report for This Property
The Home Valuation Report is an in-depth analysis detailing your home's value as well as a comparison with similar homes in the area
Home Values in the Area
Average Home Value in this Area
Purchase History
| Date | Buyer | Sale Price | Title Company |
|---|---|---|---|
| Baine Michael | $400,000 | -- | |
| Bloodgood Stacy | $205,000 | -- | |
| Mcmahon William | $90,000 | -- |
Source: Public Records
Mortgage History
| Date | Status | Borrower | Loan Amount |
|---|---|---|---|
| Open | Baine Michael | $320,000 | |
| Previous Owner | Bloodgood Stacy | $184,500 | |
| Previous Owner | Mcmahon William | $80,000 |
Source: Public Records
Tax History
| Year | Tax Paid | Tax Assessment Tax Assessment Total Assessment is a certain percentage of the fair market value that is determined by local assessors to be the total taxable value of land and additions on the property. | Land | Improvement |
|---|---|---|---|---|
| 2025 | $8,508 | $533,400 | $310,000 | $223,400 |
| 2024 | $8,048 | $479,300 | $260,000 | $219,300 |
Source: Public Records
Map
Nearby Homes
Your Personal Tour Guide
Ask me questions while you tour the home.