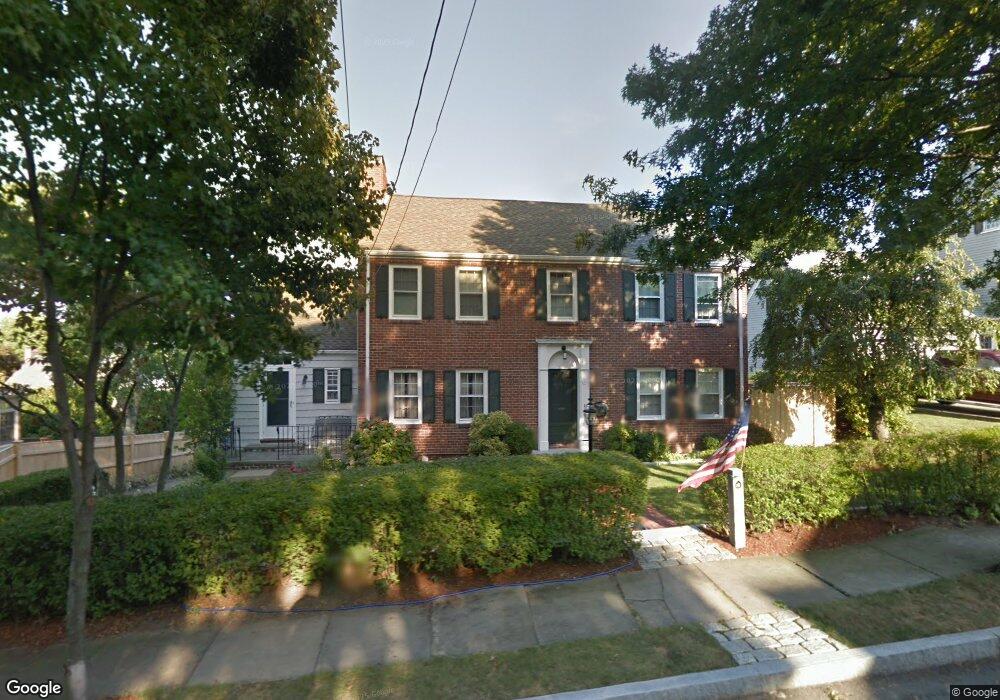
49 Elizabeth Rd Belmont, MA 02478
Cushing Square NeighborhoodEstimated Value: $1,964,997 - $2,258,000
4
Beds
4
Baths
2,548
Sq Ft
$806/Sq Ft
Est. Value
About This Home
This home is located at 49 Elizabeth Rd, Belmont, MA 02478 and is currently estimated at $2,053,749, approximately $806 per square foot. 49 Elizabeth Rd is a home located in Middlesex County with nearby schools including Mary Lee Burbank Elementary School, Winthrop L Chenery Middle School, and Belmont High School.
Ownership History
Date
Name
Owned For
Owner Type
Purchase Details
Closed on
Aug 19, 2005
Sold by
Simpson Margarita D and Simpson Russell A
Bought by
Lafauci Marybeth H and Lafauci Peter M
Current Estimated Value
Home Financials for this Owner
Home Financials are based on the most recent Mortgage that was taken out on this home.
Original Mortgage
$753,600
Outstanding Balance
$395,876
Interest Rate
5.66%
Mortgage Type
Purchase Money Mortgage
Estimated Equity
$1,657,873
Create a Home Valuation Report for This Property
The Home Valuation Report is an in-depth analysis detailing your home's value as well as a comparison with similar homes in the area
Home Values in the Area
Average Home Value in this Area
Purchase History
| Date | Buyer | Sale Price | Title Company |
|---|---|---|---|
| Lafauci Marybeth H | $946,250 | -- |
Source: Public Records
Mortgage History
| Date | Status | Borrower | Loan Amount |
|---|---|---|---|
| Open | Lafauci Marybeth H | $753,600 |
Source: Public Records
Tax History Compared to Growth
Tax History
| Year | Tax Paid | Tax Assessment Tax Assessment Total Assessment is a certain percentage of the fair market value that is determined by local assessors to be the total taxable value of land and additions on the property. | Land | Improvement |
|---|---|---|---|---|
| 2025 | $20,707 | $1,818,000 | $824,000 | $994,000 |
| 2024 | $18,818 | $1,782,000 | $976,000 | $806,000 |
| 2023 | $18,580 | $1,653,000 | $921,000 | $732,000 |
| 2022 | $17,571 | $1,520,000 | $842,000 | $678,000 |
| 2021 | $19,699 | $1,707,000 | $1,053,000 | $654,000 |
| 2020 | $16,940 | $1,540,000 | $901,000 | $639,000 |
| 2019 | $14,809 | $1,269,000 | $682,000 | $587,000 |
| 2018 | $7,540 | $1,201,000 | $620,000 | $581,000 |
| 2017 | $14,200 | $1,119,000 | $545,000 | $574,000 |
| 2016 | $13,992 | $1,114,000 | $545,000 | $569,000 |
| 2015 | $13,287 | $1,030,000 | $469,000 | $561,000 |
Source: Public Records
Map
Nearby Homes
- 36 Madison St
- 73 Foster Rd Unit 2
- 105 Watson Rd
- 276 Belmont St Unit 1
- 147 Langdon Ave Unit 149
- 30 Unity Ave Unit 30
- 125 Trapelo Rd Unit 21
- 125 Trapelo Rd Unit 23
- 133 Hillside Rd
- 263 Common St
- 118 Blanchard Rd
- 10 Marlboro St Unit 1
- 456 Belmont St Unit 10
- 456 Belmont St Unit 21
- 56-58 Edgecliff Rd
- 48 Concord Ave
- 163 Belmont St
- 81 Winsor Ave
- 87 Templeton Pkwy Unit 3
- 69 Horace Rd