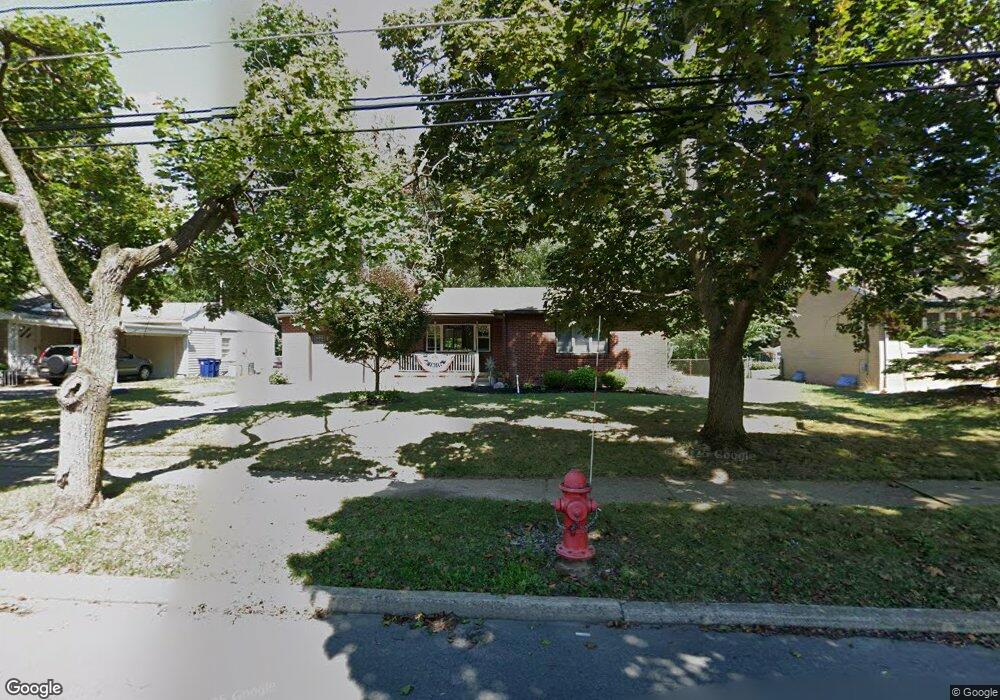
49 Gaffney Rd Lockport, NY 14094
Estimated Value: $224,000 - $250,000
3
Beds
3
Baths
1,372
Sq Ft
$172/Sq Ft
Est. Value
About This Home
This home is located at 49 Gaffney Rd, Lockport, NY 14094 and is currently estimated at $236,607, approximately $172 per square foot. 49 Gaffney Rd is a home located in Niagara County with nearby schools including Aaron Mossell Junior High School, Lockport High School, and Henrietta G Lewis Campus School.
Ownership History
Date
Name
Owned For
Owner Type
Purchase Details
Closed on
Aug 26, 2009
Sold by
Blackley Richard
Bought by
Shanley Patricia
Current Estimated Value
Home Financials for this Owner
Home Financials are based on the most recent Mortgage that was taken out on this home.
Original Mortgage
$83,250
Outstanding Balance
$53,274
Interest Rate
5.17%
Mortgage Type
New Conventional
Estimated Equity
$183,333
Purchase Details
Closed on
Aug 20, 2009
Sold by
Blackley Theresa S
Bought by
Shanley Patricia A
Home Financials for this Owner
Home Financials are based on the most recent Mortgage that was taken out on this home.
Original Mortgage
$83,250
Outstanding Balance
$53,274
Interest Rate
5.17%
Mortgage Type
New Conventional
Estimated Equity
$183,333
Purchase Details
Closed on
Apr 25, 2006
Sold by
Fritton Lt Virginia
Bought by
Blackley Richard
Create a Home Valuation Report for This Property
The Home Valuation Report is an in-depth analysis detailing your home's value as well as a comparison with similar homes in the area
Home Values in the Area
Average Home Value in this Area
Purchase History
| Date | Buyer | Sale Price | Title Company |
|---|---|---|---|
| Shanley Patricia | $92,500 | Joseph Foltz | |
| Shanley Patricia A | $92,500 | None Available | |
| Blackley Richard | $85,500 | Allen Mickell |
Source: Public Records
Mortgage History
| Date | Status | Borrower | Loan Amount |
|---|---|---|---|
| Open | Shanley Patricia A | $83,250 |
Source: Public Records
Tax History Compared to Growth
Tax History
| Year | Tax Paid | Tax Assessment Tax Assessment Total Assessment is a certain percentage of the fair market value that is determined by local assessors to be the total taxable value of land and additions on the property. | Land | Improvement |
|---|---|---|---|---|
| 2024 | $4,378 | $170,000 | $13,700 | $156,300 |
| 2023 | $3,948 | $159,000 | $13,700 | $145,300 |
| 2022 | $2,939 | $142,000 | $13,700 | $128,300 |
| 2021 | $3,219 | $97,500 | $10,600 | $86,900 |
| 2020 | $3,064 | $97,500 | $10,600 | $86,900 |
| 2019 | $843 | $97,500 | $10,600 | $86,900 |
| 2018 | $2,003 | $97,500 | $10,600 | $86,900 |
| 2017 | $1,972 | $97,500 | $10,600 | $86,900 |
| 2016 | $1,859 | $97,500 | $10,600 | $86,900 |
| 2015 | -- | $97,500 | $10,600 | $86,900 |
| 2014 | -- | $97,500 | $10,600 | $86,900 |
Source: Public Records
Map
Nearby Homes