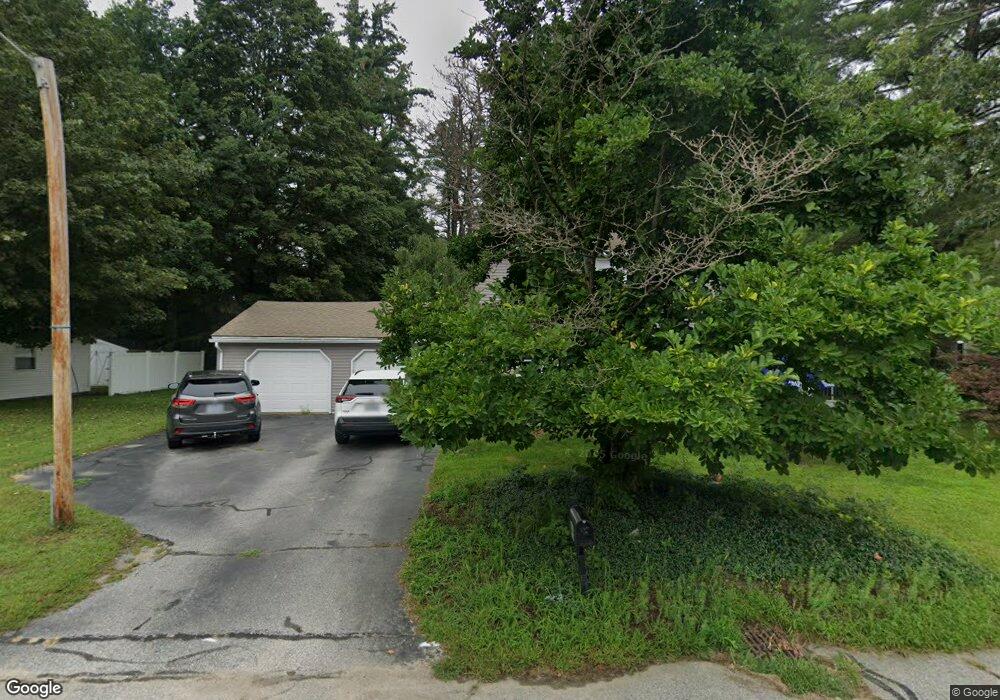
49 Heather Ln Concord, NH 03301
South End NeighborhoodEstimated Value: $530,000 - $641,000
4
Beds
3
Baths
1,764
Sq Ft
$324/Sq Ft
Est. Value
About This Home
This home is located at 49 Heather Ln, Concord, NH 03301 and is currently estimated at $571,917, approximately $324 per square foot. 49 Heather Ln is a home located in Merrimack County with nearby schools including Abbot-Downing School, Rundlett Middle School, and Concord High School.
Ownership History
Date
Name
Owned For
Owner Type
Purchase Details
Closed on
Aug 30, 2022
Sold by
Mamos Christopher T and Mamos Heather A
Bought by
Mamos Ft
Current Estimated Value
Purchase Details
Closed on
Nov 1, 2007
Sold by
Tardiff Stephen and Tardiff Noreen H
Bought by
Mamos Christopher T and Mamos Heather A
Home Financials for this Owner
Home Financials are based on the most recent Mortgage that was taken out on this home.
Original Mortgage
$263,000
Interest Rate
6.43%
Mortgage Type
Purchase Money Mortgage
Create a Home Valuation Report for This Property
The Home Valuation Report is an in-depth analysis detailing your home's value as well as a comparison with similar homes in the area
Home Values in the Area
Average Home Value in this Area
Purchase History
| Date | Buyer | Sale Price | Title Company |
|---|---|---|---|
| Mamos Ft | -- | None Available | |
| Mamos Christopher T | $329,000 | -- |
Source: Public Records
Mortgage History
| Date | Status | Borrower | Loan Amount |
|---|---|---|---|
| Previous Owner | Mamos Christopher T | $252,100 | |
| Previous Owner | Mamos Christopher T | $263,000 |
Source: Public Records
Tax History Compared to Growth
Tax History
| Year | Tax Paid | Tax Assessment Tax Assessment Total Assessment is a certain percentage of the fair market value that is determined by local assessors to be the total taxable value of land and additions on the property. | Land | Improvement |
|---|---|---|---|---|
| 2024 | $9,941 | $359,000 | $111,500 | $247,500 |
| 2023 | $9,643 | $359,000 | $111,500 | $247,500 |
| 2022 | $9,295 | $359,000 | $111,500 | $247,500 |
| 2021 | $8,900 | $354,300 | $111,500 | $242,800 |
| 2020 | $8,676 | $324,200 | $89,100 | $235,100 |
| 2019 | $8,126 | $292,500 | $87,400 | $205,100 |
| 2018 | $5,971 | $279,200 | $87,400 | $191,800 |
| 2017 | $4,348 | $265,200 | $87,400 | $177,800 |
| 2016 | $7,097 | $256,500 | $85,800 | $170,700 |
| 2015 | $6,758 | $242,300 | $89,400 | $152,900 |
| 2014 | $6,496 | $242,300 | $89,400 | $152,900 |
| 2013 | -- | $242,300 | $89,400 | $152,900 |
| 2012 | -- | $246,200 | $89,400 | $156,800 |
Source: Public Records
Map
Nearby Homes
- 53 Heather Ln
- 289 South St
- 376 S Main St
- 15 Wilson Ave
- 24 Grandview Rd
- 22 Wilson Ave
- 0 South St Unit 4969509
- 22 Longmeadow Dr
- 5 Holly Cir
- 105 S Main St
- 41 Longmeadow Dr
- 6 Woodland Cir
- 122 South St
- 24 Badger St
- 33 Spruce St
- 12 Avon St
- 0 Spruce St Unit 88
- 0 Garvins Falls Rd Unit 4 5061370
- 107 Garvins Falls Rd
- 4 Bow Center Rd Unit F2